KREIS GÃTERSLOH Vorlage Arbeit und Soziales ... - PfIO
KREIS GÃTERSLOH Vorlage Arbeit und Soziales ... - PfIO
KREIS GÃTERSLOH Vorlage Arbeit und Soziales ... - PfIO

Erfolgreiche ePaper selbst erstellen
Machen Sie aus Ihren PDF Publikationen ein blätterbares Flipbook mit unserer einzigartigen Google optimierten e-Paper Software.
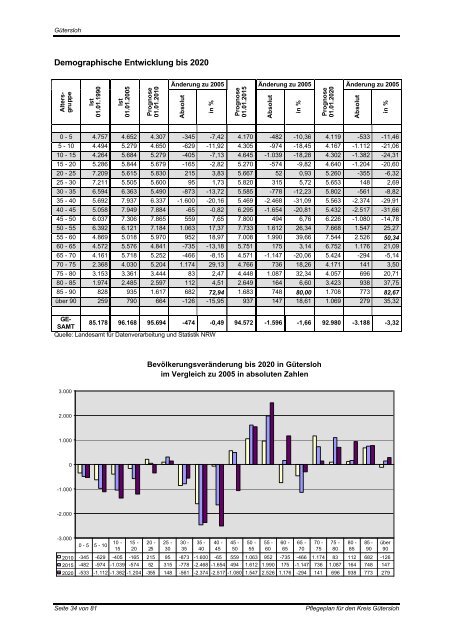
GüterslohDemographische Entwicklung bis 2020Änderung zu 2005 Änderung zu 2005 Änderung zu 2005AltersgruppeIst01.01.1990Ist01.01.2005Prognose01.01.2010Absolutin %Prognose01.01.2015Absolutin %Prognose01.01.2020Absolutin %0 - 5 4.757 4.652 4.307 -345 -7,42 4.170 -482 -10,36 4.119 -533 -11,465 - 10 4.494 5.279 4.650 -629 -11,92 4.305 -974 -18,45 4.167 -1.112 -21,0610 - 15 4.264 5.684 5.279 -405 -7,13 4.645 -1.039 -18,28 4.302 -1.382 -24,3115 - 20 5.286 5.844 5.679 -165 -2,82 5.270 -574 -9,82 4.640 -1.204 -20,6020 - 25 7.209 5.615 5.830 215 3,83 5.667 52 0,93 5.260 -355 -6,3225 - 30 7.211 5.505 5.600 95 1,73 5.820 315 5,72 5.653 148 2,6930 - 35 6.594 6.363 5.490 -873 -13,72 5.585 -778 -12,23 5.802 -561 -8,8235 - 40 5.692 7.937 6.337 -1.600 -20,16 5.469 -2.468 -31,09 5.563 -2.374 -29,9140 - 45 5.058 7.949 7.884 -65 -0,82 6.295 -1.654 -20,81 5.432 -2.517 -31,6645 - 50 6.037 7.306 7.865 559 7,65 7.800 494 6,76 6.226 -1.080 -14,7850 - 55 6.392 6.121 7.184 1.063 17,37 7.733 1.612 26,34 7.668 1.547 25,2755 - 60 4.869 5.018 5.970 952 18,97 7.008 1.990 39,66 7.544 2.526 50,3460 - 65 4.572 5.576 4.841 -735 -13,18 5.751 175 3,14 6.752 1.176 21,0965 - 70 4.161 5.718 5.252 -466 -8,15 4.571 -1.147 -20,06 5.424 -294 -5,1470 - 75 2.368 4.030 5.204 1.174 29,13 4.766 736 18,26 4.171 141 3,5075 - 80 3.153 3.361 3.444 83 2,47 4.448 1.087 32,34 4.057 696 20,7180 - 85 1.974 2.485 2.597 112 4,51 2.649 164 6,60 3.423 938 37,7585 - 90 828 935 1.617 682 72,94 1.683 748 80,00 1.708 773 82,67über 90 259 790 664 -126 -15,95 937 147 18,61 1.069 279 35,32GE-85.178 96.168 95.694 -474 -0,49 94.572 -1.596 -1,66 92.980 -3.188 -3,32SAMTQuelle: Landesamt für Datenverarbeitung <strong>und</strong> Statistik NRWBevölkerungsveränderung bis 2020 in Güterslohim Vergleich zu 2005 in absoluten Zahlen3.0002.0001.0000-1.000-2.000-3.0000 - 5 5 - 1010 -1515 -2020 -2525 -3030 -3535 -4040 -452010 -345 -629 -405 -165 215 95 -873 -1.600 -65 559 1.063 952 -735 -466 1.174 83 112 682 -1262015 -482 -974 -1.039 -574 52 315 -778 -2.468 -1.654 494 1.612 1.990 175 -1.147 736 1.087 164 748 1472020 -533 -1.112 -1.382 -1.204 -355 148 -561 -2.374 -2.517 -1.080 1.547 2.526 1.176 -294 141 696 938 773 27945 -5050 -5555 -6060 -6565 -7070 -7575 -8080 -8585 -90über90Seite 34 von 81Pflegeplan für den Kreis Gütersloh