

(RPL) Assessment Tool Kit - WestOne
(RPL) Assessment Tool Kit - WestOne
(RPL) Assessment Tool Kit - WestOne

Create successful ePaper yourself
Turn your PDF publications into a flip-book with our unique Google optimized e-Paper software.
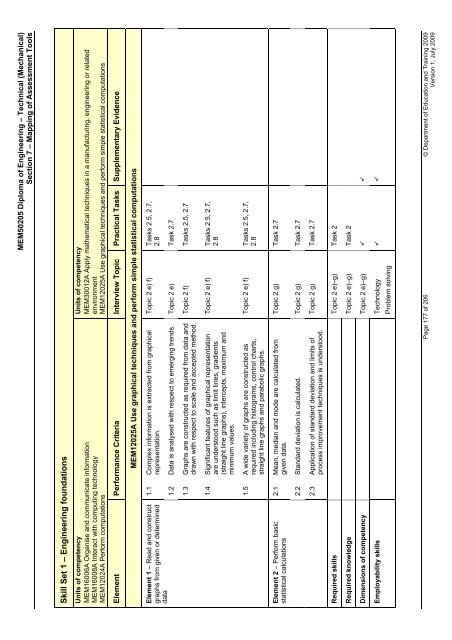
MEM50205 Diploma of Engineering – Technical (Mechanical)<br />
Section 7 – Mapping of <strong>Assessment</strong> <strong>Tool</strong>s<br />
Skill Set 1 – Engineering foundations<br />
Units of competency<br />
MEM30012A Apply mathematical techniques in a manufacturing, engineering or related<br />
environment<br />
MEM12025A Use graphical techniques and perform simple statistical computations<br />
Units of competency<br />
MEM16006A Organise and communicate information<br />
MEM16008A Interact with computing technology<br />
MEM12024A Perform computations<br />
Element Performance Criteria Interview Topic Practical Tasks Supplementary Evidence<br />
MEM12025A Use graphical techniques and perform simple statistical computations<br />
Topic 2 e) f) Tasks 2.5, 2.7,<br />
2.8<br />
1.1 Complex information is extracted from graphical<br />
representation.<br />
Element 1 – Read and construct<br />
graphs from given or determined<br />
data<br />
1.2 Data is analysed with respect to emerging trends. Topic 2 e) Task 2.7<br />
Topic 2 f) Tasks 2.5, 2.7<br />
1.3 Graphs are constructed as required from data and<br />
drawn with respect to scale and accepted method.<br />
Topic 2 e) f) Tasks 2.5, 2.7,<br />
2.8<br />
1.4 Significant features of graphical representation<br />
are understood such as limit lines, gradients<br />
(straight line graphs), intercepts, maximum and<br />
minimum values.<br />
Topic 2 e) f) Tasks 2.5, 2.7,<br />
2.8<br />
1.5 A wide variety of graphs are constructed as<br />
required including histograms, control charts,<br />
straight line graphs and parabolic graphs.<br />
Topic 2 g) Task 2.7<br />
2.1 Mean, median and mode are calculated from<br />
given data.<br />
Element 2 – Perform basic<br />
statistical calculations<br />
2.2 Standard deviation is calculated. Topic 2 g) Task 2.7<br />
Topic 2 g) Task 2.7<br />
2.3 Application of standard deviation and limits of<br />
process improvement techniques is understood.<br />
Required skills Topic 2 e)–g) Task 2<br />
Required knowledge Topic 2 e)–g) Task 2<br />
Dimensions of competency Topic 2 e)–g) � �<br />
� �<br />
Employability skills Technology<br />
Problem solving<br />
Page 177 of 206 © Department of Education and Training 2009<br />
Version 1, July 2009