PNNL-13501 - Pacific Northwest National Laboratory
PNNL-13501 - Pacific Northwest National Laboratory
PNNL-13501 - Pacific Northwest National Laboratory

Create successful ePaper yourself
Turn your PDF publications into a flip-book with our unique Google optimized e-Paper software.
selection of seedlings demonstrating no contamination,<br />
and aseptic transfer to sterile nutrient solution (tenthstrength<br />
Hoagland’s) oxygenated with 0.22 µ filtered air.<br />
Growth conditions included a light intensity of 300 µE<br />
m -2 sec -1 , (fluorescent/incandescent mix), 18 to 23°C<br />
day/night temperatures, and 60% R.H. Continual sterility<br />
checks were performed on the roots and nutrient solution.<br />
The microscope for observing siderophore uptake was<br />
assembled along with a newly designed and constructed<br />
plant holder, consisting of a Nikon TE-300 inverted<br />
optical microscope with CFI60 infinity optics, fitted with<br />
Toshiba Tu40A 3-chip color CCD camera, Scion CG7<br />
color frame grabber, imaging software, a Nikon optical<br />
camera, a thermoelectrically cooled Hamamatsu 4220p<br />
photon counting photomultiplier tube, a Stanford<br />
Research SR400 two-channel gated photon counter, and a<br />
Ludl LEP Biopoint computer controlled multi-axis<br />
translation stage. A specially made sample holder was<br />
attached to the sample translation stage permitting direct<br />
observation and laser induced fluorescence imaging of a<br />
live plant root in its growth media.<br />
Results and Accomplishments<br />
Critical to the study was the requirement that there be no<br />
interference from the native fluorescence of plant tissues<br />
or extracellular siderophores on the resolution of<br />
europium in and out of the plant and the confirmation of<br />
spectral changes following uptake and complexation<br />
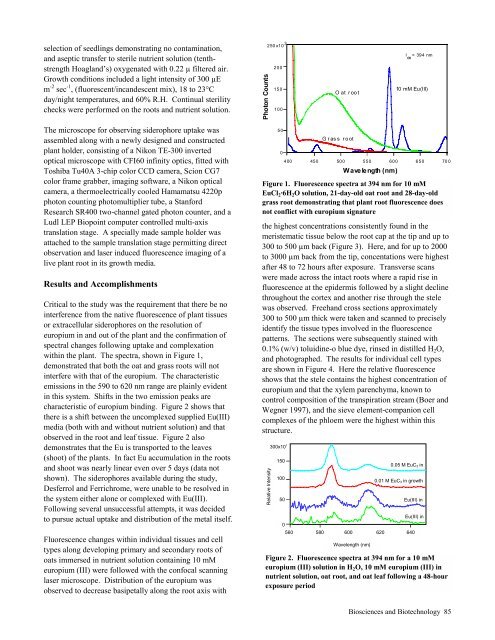
within the plant. The spectra, shown in Figure 1,<br />
demonstrated that both the oat and grass roots will not<br />
interfere with that of the europium. The characteristic<br />
emissions in the 590 to 620 nm range are plainly evident<br />
in this system. Shifts in the two emission peaks are<br />
characteristic of europium binding. Figure 2 shows that<br />
there is a shift between the uncomplexed supplied Eu(III)<br />
media (both with and without nutrient solution) and that<br />
observed in the root and leaf tissue. Figure 2 also<br />
demonstrates that the Eu is transported to the leaves<br />
(shoot) of the plants. In fact Eu accumulation in the roots<br />
and shoot was nearly linear even over 5 days (data not<br />
shown). The siderophores available during the study,<br />
Desferrol and Ferrichrome, were unable to be resolved in<br />
the system either alone or complexed with Eu(III).<br />
Following several unsuccessful attempts, it was decided<br />
to pursue actual uptake and distribution of the metal itself.<br />
Fluorescence changes within individual tissues and cell<br />
types along developing primary and secondary roots of<br />
oats immersed in nutrient solution containing 10 mM<br />
europium (III) were followed with the confocal scanning<br />
laser microscope. Distribution of the europium was<br />
observed to decrease basipetally along the root axis with<br />
Photon Counts<br />
250x10 3<br />
the highest concentrations consistently found in the<br />
meristematic tissue below the root cap at the tip and up to<br />
300 to 500 µm back (Figure 3). Here, and for up to 2000<br />
to 3000 µm back from the tip, concentations were highest<br />
after 48 to 72 hours after exposure. Transverse scans<br />
were made across the intact roots where a rapid rise in<br />
fluorescence at the epidermis followed by a slight decline<br />
throughout the cortex and another rise through the stele<br />
was observed. Freehand cross sections approximately<br />
300 to 500 µm thick were taken and scanned to precisely<br />
identify the tissue types involved in the fluorescence<br />
patterns. The sections were subsequently stained with<br />
0.1% (w/v) toluidine-o blue dye, rinsed in distilled H2O,<br />
and photographed. The results for individual cell types<br />
are shown in Figure 4. Here the relative fluorescence<br />
shows that the stele contains the highest concentration of<br />
europium and that the xylem parenchyma, known to<br />
control composition of the transpiration stream (Boer and<br />
Wegner 1997), and the sieve element-companion cell<br />
complexes of the phloem were the highest within this<br />
structure.<br />
Relative Intensity<br />
200<br />
150<br />
100<br />
50<br />
0<br />
300x10 3<br />
150<br />
100<br />
50<br />
400<br />
0<br />
560<br />
450<br />
Oat root<br />
Grass root<br />
500<br />
0.05 M EuC3 in<br />
0.01 M EuC3 in growth<br />
580 600 620 640<br />
Wavelength (nm)<br />
Eu(III) in<br />
Eu(III) in<br />
Figure 2. Fluorescence spectra at 394 nm for a 10 mM<br />
europium (III) solution in H 2O, 10 mM europium (III) in<br />
nutrient solution, oat root, and oat leaf following a 48-hour<br />
exposure period<br />
550<br />
600<br />
Wavelength(nm)<br />
l ex =394nm<br />
10 mM Eu (III)<br />
Figure 1. Fluorescence spectra at 394 nm for 10 mM<br />
EuCl 2·6H 2O solution, 21-day-old oat root and 28-day-old<br />
grass root demonstrating that plant root fluorescence does<br />
not conflict with europium signature<br />
650<br />
70 0<br />
Biosciences and Biotechnology 85