PNNL-13501 - Pacific Northwest National Laboratory
PNNL-13501 - Pacific Northwest National Laboratory
PNNL-13501 - Pacific Northwest National Laboratory

You also want an ePaper? Increase the reach of your titles
YUMPU automatically turns print PDFs into web optimized ePapers that Google loves.
In the optical microscopy image, the right side of the bead<br />
and the top right side of the oocyte are poorly defined.<br />
This is due to the presence of three small oocytes in the<br />
optical path and below the optical microscopy plane,<br />
which produce shadows in the plane of interest. The high<br />
optical microscopy intensity at the oocyte boundary is<br />
believed to arise from the mitochondria in the surrounding<br />
follicle cell layer, while the interior is optically opaque.<br />
Additional features include stained connective tissue near<br />
the oocyte and a fluorescing layer along the inner wall of<br />
the sample tube. We conclude that excellent image<br />
registration of both images is obtained. Figure 2 shows<br />
similar confocal and magnetic resonance images obtained<br />
on a smaller stage-2 (0.38-mm-diameter) transparent<br />
oocyte. In contrast to results obtained on the larger<br />
oocyte, the confocal image clearly shows the<br />
mitochondrial cloud, whereas in the water magnetic<br />
resonance image, only an inside layer of enhanced water<br />
intensity is detected. The results clearly illustrate that<br />
combined microscopy provides significantly more<br />
information than obtained with each of the techniques<br />
individually. The magnetic resonance images provide<br />
detailed information about the intra-cellular structure of<br />
the larger opaque oocyte that is not observed with optical<br />
microscopy. On the other hand, in the smaller transparent<br />
oocytes, the high-resolution optical images can be used to<br />
complement the relatively low-resolution magnetic<br />
resonance images.<br />
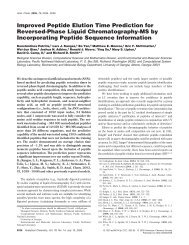
Figure 2. Application of confocal image data to enhance the<br />
resolution and contrast of magnetic resonance images at<br />
object boundaries. (a) magnetic resonance water image of<br />
the stage-2 oocyte; (b) optical microscopy image of the same<br />
oocyte, and the contour plot, obtained from this image; (c)<br />
magnetic resonance image with enhanced resolution and<br />
contrast near the contour boundaries. Enhancement was<br />
achieved by overlaying the image (a) and the contour plot (b)<br />
to distinguish magnetic resonance image pixels containing<br />
the boundaries between the cell and the surrounding<br />
medium. Next, the average magnetic resonance intensities in<br />
these pixels were redistributed using the confocal<br />
boundaries. The scale bar shown in (b) is 0.2 mm in length.<br />
First Optical Microscopy/Magnetic Resonance<br />
Microscopy Application: Sharpening of the Magnetic<br />
Resonance Images<br />
The a priori knowledge provided by the confocal image<br />
can be used to improve the boundary resolution and the<br />
contrast in the magnetic resonance images. This is<br />
illustrated in Figure 2 as well. By overlaying the highresolution<br />
optical contour plot, given in Figure 2b, with<br />
the relatively low-resolution magnetic resonance image<br />
shown in Figure 2a, image pixels can be identified in the<br />
magnetic resonance image containing the boundary<br />
between the oocyte and the surrounding medium. Then<br />
the average intensity in each of these pixels can be<br />
redistributed into each compartment inside these pixels.<br />
Figure 2c shows the resulting magnetic resonance image.<br />
It follows that both the boundary resolution and contrast<br />
are significantly enhanced. Hence integrated optical<br />
microscopy/magnetic resonance microscopy can be used<br />
to produce images in which the optical spatial resolution<br />
is combined with the magnetic resonance contrast, which<br />
could be important for a variety of applications, including<br />
the diagnosis of diseased cells.<br />
Statistical Analysis<br />
The research and development of algorithms to analyze<br />
the combined measurement sets from the magnetic<br />
resonance and optical microscopes focused on three<br />
problems: 1) image and spectrum enhancement, 2) image<br />
registration (alignment of data spaces), and 3) spectral<br />
unmixing/spectral sharpening. The first problem involves<br />
the elimination or minimization of measuring artifacts.<br />
The second problem is due to differences in physical<br />
alignment, resolution, and measuring mode of the two<br />
distinct instruments. The third problem is about<br />
capitalizing on the complementary, but distinct,<br />
information provided by two distinct instruments<br />
simultaneously measuring the same sample. Solutions to<br />
these problems using existing software such as Image-J<br />
by NIH and IBM’s OpenDX melded with custom<br />
components are being explored. At this time, we have<br />
identified the necessary operations (deconvolution, image<br />
warping, spectral unmixing); we have derived preliminary<br />
algorithms, and have developed prototype subroutines.<br />
We have not, as yet, developed a refined and integrated<br />
analysis package.<br />
Biosciences and Biotechnology 55