

Fruits and Vegetables in Vietnam - International Food Policy ...
Fruits and Vegetables in Vietnam - International Food Policy ...
Fruits and Vegetables in Vietnam - International Food Policy ...

You also want an ePaper? Increase the reach of your titles
YUMPU automatically turns print PDFs into web optimized ePapers that Google loves.
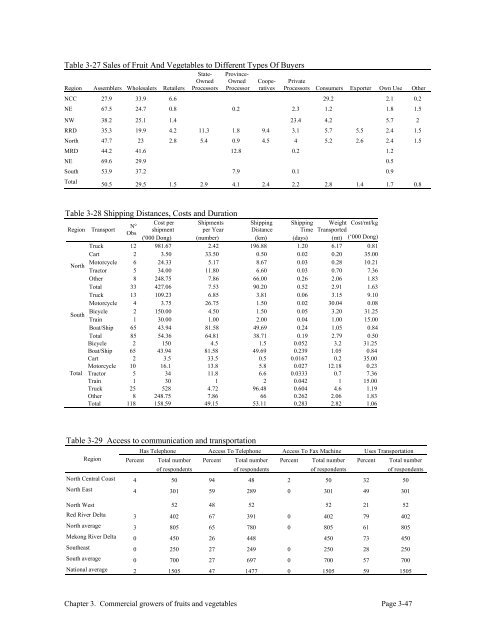
Table 3-27 Sales of Fruit And <strong>Vegetables</strong> to Different Types Of Buyers<br />
Region Assemblers Wholesalers Retailers<br />
State-<br />
Owned<br />
Processors<br />
Prov<strong>in</strong>ce-<br />
Owned<br />
Processor<br />
Coope-<br />
ratives<br />
Private<br />
Processors Consumers Exporter Own Use Other<br />
NCC 27.9 33.9 6.6 29.2 2.1 0.2<br />
NE 67.5 24.7 0.8 0.2 2.3 1.2 1.8 1.5<br />
NW 38.2 25.1 1.4 23.4 4.2 5.7 2<br />
RRD 35.3 19.9 4.2 11.3 1.8 9.4 3.1 5.7 5.5 2.4 1.5<br />
North 47.7 23 2.8 5.4 0.9 4.5 4 5.2 2.6 2.4 1.5<br />
MRD 44.2 41.6 12.8 0.2 1.2<br />
NE 69.6 29.9 0.5<br />
South 53.9 37.2 7.9 0.1 0.9<br />
Total<br />
50.5 29.5 1.5 2.9 4.1 2.4 2.2 2.8 1.4 1.7 0.8<br />
Table 3-28 Shipp<strong>in</strong>g Distances, Costs <strong>and</strong> Duration<br />
Region Transport<br />
N<br />
Cost per<br />
shipment<br />
Shipments<br />
per Year<br />
Shipp<strong>in</strong>g<br />
Distance<br />
Shipp<strong>in</strong>g Weight<br />
Time Transported<br />
o<br />
Obs<br />
('000 Dong) (number) (km)<br />
Cost/mt/kg<br />
(days) (mt) (‘000 Dong)<br />
Truck 12 981.67 2.42 196.88 1.20 6.17 0.81<br />
Cart 2 3.50 33.50 0.50 0.02 0.20 35.00<br />
Motorcycle<br />
North<br />
Tractor<br />
6<br />
5<br />
24.33<br />
34.00<br />
5.17<br />
11.80<br />
8.67<br />
6.60<br />
0.03<br />
0.03<br />
0.28<br />
0.70<br />
10.21<br />
7.36<br />
Other 8 248.75 7.86 66.00 0.26 2.06 1.83<br />
Total 33 427.06 7.53 90.20 0.52 2.91 1.63<br />
Truck 13 109.23 6.85 3.81 0.06 3.15 9.10<br />
Motorcycle 4 3.75 26.75 1.50 0.02 30.04 0.08<br />
Bicycle<br />
South<br />
Tra<strong>in</strong><br />
2<br />
1<br />
150.00<br />
30.00<br />
4.50<br />
1.00<br />
1.50<br />
2.00<br />
0.05<br />
0.04<br />
3.20<br />
1.00<br />
31.25<br />
15.00<br />
Boat/Ship 65 43.94 81.58 49.69 0.24 1.05 0.84<br />
Total 85 54.36 64.81 38.71 0.19 2.79 0.50<br />
Bicycle 2 150 4.5 1.5 0.052 3.2 31.25<br />
Boat/Ship 65 43.94 81.58 49.69 0.239 1.05 0.84<br />
Cart 2 3.5 33.5 0.5 0.0167 0.2 35.00<br />
Motorcycle 10 16.1 13.8 5.8 0.027 12.18 0.23<br />
Total Tractor 5 34 11.8 6.6 0.0333 0.7 7.36<br />
Tra<strong>in</strong> 1 30 1 2 0.042 1 15.00<br />
Truck 25 528 4.72 96.48 0.604 4.6 1.19<br />
Other 8 248.75 7.86 66 0.262 2.06 1.83<br />
Total 118 158.59 49.15 53.11 0.283 2.82 1.06<br />
Table 3-29 Access to communication <strong>and</strong> transportation<br />
Has Telephone Access To Telephone Access To Fax Mach<strong>in</strong>e Uses Transportation<br />
Region Percent Total number Percent Total number Percent Total number Percent Total number<br />
of respondents of respondents of respondents of respondents<br />
North Central Coast 4 50 94 48 2 50 32 50<br />
North East 4 301 59 289 0 301 49 301<br />
North West 52 48 52 52 21 52<br />
Red River Delta 3 402 67 391 0 402 79 402<br />
North average 3 805 65 780 0 805 61 805<br />
Mekong River Delta 0 450 26 448 450 73 450<br />
Southeast 0 250 27 249 0 250 28 250<br />
South average 0 700 27 697 0 700 57 700<br />
National average 2 1505 47 1477 0 1505 59 1505<br />
Chapter 3. Commercial growers of fruits <strong>and</strong> vegetables Page 3-47


