

Fruits and Vegetables in Vietnam - International Food Policy ...
Fruits and Vegetables in Vietnam - International Food Policy ...
Fruits and Vegetables in Vietnam - International Food Policy ...

Create successful ePaper yourself
Turn your PDF publications into a flip-book with our unique Google optimized e-Paper software.
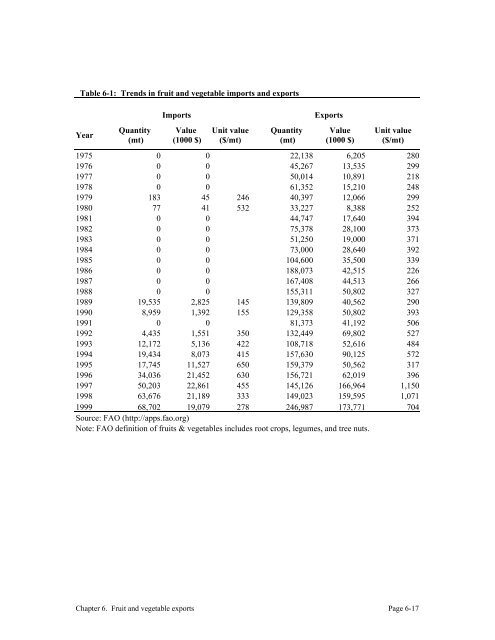
Table 6-1: Trends <strong>in</strong> fruit <strong>and</strong> vegetable imports <strong>and</strong> exports<br />
Year<br />
Quantity<br />
(mt)<br />
Imports Exports<br />
Value<br />
(1000 $)<br />
Unit value<br />
($/mt)<br />
Quantity<br />
(mt)<br />
Value<br />
(1000 $)<br />
Unit value<br />
($/mt)<br />
1975 0 0 22,138 6,205 280<br />
1976 0 0 45,267 13,535 299<br />
1977 0 0 50,014 10,891 218<br />
1978 0 0 61,352 15,210 248<br />
1979 183 45 246 40,397 12,066 299<br />
1980 77 41 532 33,227 8,388 252<br />
1981 0 0 44,747 17,640 394<br />
1982 0 0 75,378 28,100 373<br />
1983 0 0 51,250 19,000 371<br />
1984 0 0 73,000 28,640 392<br />
1985 0 0 104,600 35,500 339<br />
1986 0 0 188,073 42,515 226<br />
1987 0 0 167,408 44,513 266<br />
1988 0 0 155,311 50,802 327<br />
1989 19,535 2,825 145 139,809 40,562 290<br />
1990 8,959 1,392 155 129,358 50,802 393<br />
1991 0 0 81,373 41,192 506<br />
1992 4,435 1,551 350 132,449 69,802 527<br />
1993 12,172 5,136 422 108,718 52,616 484<br />
1994 19,434 8,073 415 157,630 90,125 572<br />
1995 17,745 11,527 650 159,379 50,562 317<br />
1996 34,036 21,452 630 156,721 62,019 396<br />
1997 50,203 22,861 455 145,126 166,964 1,150<br />
1998 63,676 21,189 333 149,023 159,595 1,071<br />
1999 68,702 19,079 278 246,987 173,771 704<br />
Source: FAO (http://apps.fao.org)<br />
Note: FAO def<strong>in</strong>ition of fruits & vegetables <strong>in</strong>cludes root crops, legumes, <strong>and</strong> tree nuts.<br />
Chapter 6. Fruit <strong>and</strong> vegetable exports Page 6-17


