- Page 1:
Fruits and Vegetables in Vietnam: A
- Page 4 and 5:
Ta Minh Tuan SOFRI Data collection
- Page 7 and 8:
Table of Contents Chapter 1: Introd
- Page 9 and 10:
Chapter 5: Characteristics of fruit
- Page 11 and 12:
List of Tables Table 2-1: Trends in
- Page 13 and 14:
Table 5-7: Proportion of processors
- Page 15 and 16:
List of Figures Figure 2-1: Growth
- Page 17 and 18:
Chapter 1 Introduction This is the
- Page 19 and 20:
quality. In addition, they may face
- Page 21 and 22:
This, in turn, creates an incentive
- Page 23 and 24:
definition is also convenient becau
- Page 25 and 26:
Chapter 2 Patterns and trends in fr
- Page 27 and 28:
south, and different varieties of l
- Page 29 and 30:
fruits and vegetables. Because of t
- Page 31 and 32:
2.2 Characteristics of fruit and ve
- Page 33 and 34:
and to fruits, for which the corres
- Page 35 and 36:
2.4 Input use How widespread is the
- Page 37 and 38:
• The calculations do not take in
- Page 39 and 40:
Figure 2-6. Change in the percentag
- Page 41 and 42:
1993, the share of output sold was
- Page 43 and 44:
Table 2-1: Trends in planted area o
- Page 45 and 46:
Table 2-3: Trends in planted area o
- Page 47 and 48:
Table 2-5: Trends in planted area o
- Page 49 and 50:
Table 2-7: Trends in gross value of
- Page 51 and 52:
Table 2-10: Plan for fruit and vege
- Page 53 and 54:
Table 2-12: Percentage of rural hou
- Page 55 and 56:
Table 2-14. Distribution of farm ho
- Page 57 and 58:
Table 2-17: Share of fruit and vege
- Page 59 and 60:
Table 2-19: Share of growers sellin
- Page 61 and 62:
Table 2-21: Percentage of fruit and
- Page 63 and 64:
Table 2-23: Percentage of fruit and
- Page 65 and 66:
Table 2-25. Gross and net revenue f
- Page 67 and 68:
Table 2-27. Gross and net revenue f
- Page 69 and 70:
Table 2-29. Comparison of fruit and
- Page 71 and 72:
1 Introduction Chapter 3 Commercial
- Page 73 and 74:
2.4 Sources of revenue Survey respo
- Page 75 and 76:
that year, with similar patterns by
- Page 77 and 78:
The most popular tomato varieties a
- Page 79 and 80:
5.2 Culling of fruit Trees The majo
- Page 81 and 82:
Producers in Ha Noi, however, have
- Page 83 and 84:
The amount of manure used by dragon
- Page 85 and 86:
Producers generally do not rent sto
- Page 87 and 88:
For longan and litchi producers the
- Page 89 and 90:
contractors while 97 percent said t
- Page 91 and 92:
Box 3-3. Lam Dong farmers face risk
- Page 93 and 94:
percent had access to a telephone,
- Page 95 and 96:
9.3 Quality of Extension Organizati
- Page 97 and 98:
10.2 Credit sources As Table 3-40 s
- Page 99 and 100:
these laborers account for about ha
- Page 101 and 102:
Table 3-1 Sample Locations and Prod
- Page 103 and 104:
Table 3-6 Sources of revenue by reg
- Page 105 and 106:
Table 3-10 Profitability of Househo
- Page 107 and 108:
Table 3-12 Planting Profile for Cro
- Page 109 and 110:
Table 3-14 Production Profile for S
- Page 111 and 112:
Table 3-16 Fruit and Vegetable Mana
- Page 113 and 114:
Table 3-18 Propagation Methods for
- Page 115 and 116:
Table 3-22 Production, Sales, Consu
- Page 117 and 118:
Table 3-27 Sales of Fruit And Veget
- Page 119 and 120:
Table 3-32 Proportion of Crop Affec
- Page 121 and 122:
Table 3-36 Extension services provi
- Page 123 and 124:
Table 3-39 Credit Usage by Region R
- Page 125 and 126:
1 Introduction Chapter 4 Fruit and
- Page 127 and 128:
elated activities. The large differ
- Page 129 and 130:
traders (16.2). Wages paid by expor
- Page 131 and 132:
Figure 4-1. Percentage of traders r
- Page 133 and 134:
The average exporter was a member o
- Page 135 and 136:
About 85 percent of fruit and veget
- Page 137 and 138:
Only 17.0 and 28.7 percent of trade
- Page 139 and 140:
domestic traders. In the South, onl
- Page 141 and 142:
traders used refrigerated trucks to
- Page 143 and 144:
price information in domestic and i
- Page 145 and 146:
The average trader in employed 47 w
- Page 147 and 148:
Table 4-3. Percentage of traders us
- Page 149 and 150:
Table 4-6. Sources of post-startup
- Page 151 and 152:
Table 4-10. Types of post-harvest a
- Page 153 and 154:
Table 4-13. Types of post-harvest a
- Page 155 and 156:
Table 4-15. Characteristics of meas
- Page 157 and 158:
Table 4-19. Organizations that insp
- Page 159 and 160:
Table 4-23. Prevalence and characte
- Page 161:
Table 4-25. Characteristics of prof
- Page 164 and 165:
operating expenses, and profits of
- Page 166 and 167:
The daily wage varies from VND 34 t
- Page 168 and 169:
processors wanting to access more l
- Page 170 and 171:
private farms and traders, together
- Page 172 and 173:
processors taking no action to ensu
- Page 174 and 175:
The most common types of processed
- Page 176 and 177:
while 18 percent use a closed shed,
- Page 178 and 179:
Only 12 percent of the processors s
- Page 180 and 181:
all of the lending institutions (VN
- Page 182 and 183:
The main reason cited by processors
- Page 184 and 185:
11.2 Perceived level of Competition
- Page 186 and 187:
Despite the fact that processors ut
- Page 188 and 189:
Table 5-3. Distribution of manager
- Page 190 and 191:
Table 5-9. Distribution of function
- Page 192 and 193:
Table 5-14. Percentage of processor
- Page 194 and 195: Table 5-21. Capacity utilization (%
- Page 196 and 197: Table 5-27. Proportion of sales to
- Page 198 and 199: Table 5-33. Percent of processors r
- Page 200 and 201: Table 5-38. Revenue and costs for d
- Page 202 and 203: Table 5-40. Value added and asset r
- Page 205 and 206: 1 Introduction Chapter 6 Fruit and
- Page 207 and 208: Like other exports, fruit and veget
- Page 209 and 210: Figure 6-1. Trend in exports of fru
- Page 211 and 212: As a result, China is the largest e
- Page 213 and 214: short distance, belonging to AFTA,
- Page 215 and 216: In September 1999, the government i
- Page 217 and 218: Of course, expanding exports cannot
- Page 219 and 220: The past five years, there has been
- Page 221 and 222: Table 6-1: Trends in fruit and vege
- Page 223 and 224: Table 6-3: Destination of Vietnames
- Page 225 and 226: Table 6-5. Composition of Vietnames
- Page 227 and 228: Table 6-7. Fruit tariff reduction s
- Page 229 and 230: 1 Introduction Chapter 7 Fruit and
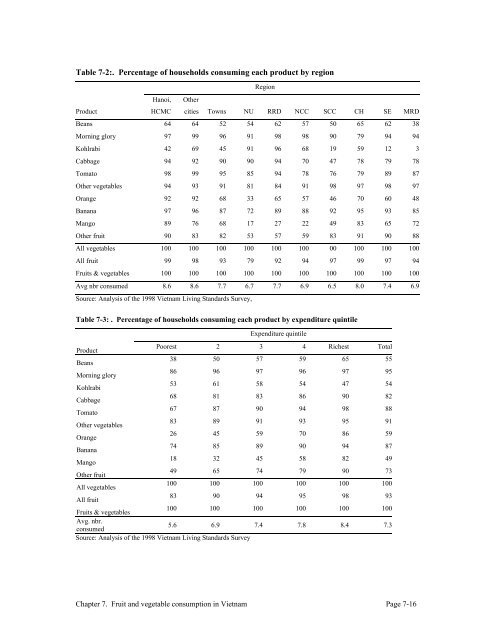
- Page 231 and 232: the case of kohlrabi, which is cons
- Page 233 and 234: Figure 7-2. Consumption of fruits a
- Page 235 and 236: The results of the demand analysis
- Page 237 and 238: Of the ten categories of fruits and
- Page 239 and 240: 5 Retail marketing of fruits and ve
- Page 241 and 242: ands, but additional products can b
- Page 243: Table 7-1. Summary of fruit and veg
- Page 247 and 248: Table 7-8. Share of consumption fro
- Page 249 and 250: Table 7-12. Determinants of Demand
- Page 251 and 252: Table 7-16. Determinants of Demand
- Page 253 and 254: Table 7-20. Determinants of Demand
- Page 255: Table 7-24. Comparison of fruit and
- Page 258 and 259: In recognition of the marketing pro
- Page 260 and 261: was obliged to cover its cost with
- Page 262 and 263: The company has a staff of 200 work
- Page 264 and 265: Given this background, it would be
- Page 266 and 267: 4 Plant protection Plant protection
- Page 268 and 269: attitudes toward pesticide risk, th
- Page 270 and 271: options are understood, the final s
- Page 272 and 273: gave them the contacts and marketin
- Page 274 and 275: 7 Summary and conclusions The insti
- Page 276 and 277: combination of random testing in th
- Page 278 and 279: just over half (54 percent) of the
- Page 280 and 281: government institutions, particular
- Page 282 and 283: The average gross revenue among the
- Page 284 and 285: smaller processors experienced a gr
- Page 286 and 287: household category (83 percent of w
- Page 288 and 289: growers, forcing them to improve ef
- Page 290 and 291: The government should facilitate pr
- Page 292 and 293: countries are becoming increasingly
- Page 295 and 296:
Bibliography ANZDEC/IFPRI/Lincoln.
- Page 297:
Vietnam News Service. 2001. “Grow