Fruits and Vegetables in Vietnam - International Food Policy ...
Fruits and Vegetables in Vietnam - International Food Policy ...
Fruits and Vegetables in Vietnam - International Food Policy ...
You also want an ePaper? Increase the reach of your titles
YUMPU automatically turns print PDFs into web optimized ePapers that Google loves.
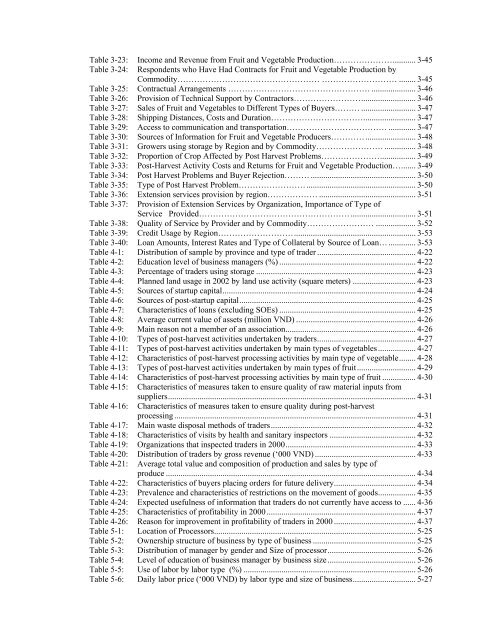
Table 3-23: Income <strong>and</strong> Revenue from Fruit <strong>and</strong> Vegetable Production…………………........... 3-45<br />
Table 3-24: Respondents who Have Had Contracts for Fruit <strong>and</strong> Vegetable Production by<br />
Commodity…………………………………………… ……………………… ........ 3-45<br />
Table 3-25: Contractual Arrangements …………………………………………… ..................... 3-46<br />
Table 3-26: Provision of Technical Support by Contractors…………………….......................... 3-46<br />
Table 3-27: Sales of Fruit <strong>and</strong> <strong>Vegetables</strong> to Different Types of Buyers……… .......................... 3-47<br />
Table 3-28: Shipp<strong>in</strong>g Distances, Costs <strong>and</strong> Duration……………………………......................... 3-47<br />
Table 3-29: Access to communication <strong>and</strong> transportation……………………………… ............. 3-47<br />
Table 3-30: Sources of Information for Fruit <strong>and</strong> Vegetable Producers…………........................ 3-48<br />
Table 3-31: Growers us<strong>in</strong>g storage by Region <strong>and</strong> by Commodity…………………… ............... 3-48<br />
Table 3-32: Proportion of Crop Affected by Post Harvest Problems…………………................. 3-49<br />
Table 3-33: Post-Harvest Activity Costs <strong>and</strong> Returns for Fruit <strong>and</strong> Vegetable Production…....... 3-49<br />
Table 3-34: Post Harvest Problems <strong>and</strong> Buyer Rejection……… .................................................. 3-50<br />
Table 3-35: Type of Post Harvest Problem…………………….................................................... 3-50<br />
Table 3-36: Extension services provision by region……………… .............................................. 3-51<br />
Table 3-37: Provision of Extension Services by Organization, Importance of Type of<br />
Service Provided……………………………………………… ............................... 3-51<br />
Table 3-38: Quality of Service by Provider <strong>and</strong> by Commodity…………………… ................... 3-52<br />
Table 3-39: Credit Usage by Region……………………….......................................................... 3-53<br />
Table 3-40: Loan Amounts, Interest Rates <strong>and</strong> Type of Collateral by Source of Loan… ............. 3-53<br />
Table 4-1: Distribution of sample by prov<strong>in</strong>ce <strong>and</strong> type of trader ............................................... 4-22<br />
Table 4-2: Education level of bus<strong>in</strong>ess managers (%) ................................................................. 4-22<br />
Table 4-3: Percentage of traders us<strong>in</strong>g storage ............................................................................ 4-23<br />
Table 4-4: Planned l<strong>and</strong> usage <strong>in</strong> 2002 by l<strong>and</strong> use activity (square meters) .............................. 4-23<br />
Table 4-5: Sources of startup capital............................................................................................ 4-24<br />
Table 4-6: Sources of post-startup capital.................................................................................... 4-25<br />
Table 4-7: Characteristics of loans (exclud<strong>in</strong>g SOEs) ................................................................. 4-25<br />
Table 4-8: Average current value of assets (million VND) ......................................................... 4-26<br />
Table 4-9: Ma<strong>in</strong> reason not a member of an association.............................................................. 4-26<br />
Table 4-10: Types of post-harvest activities undertaken by traders............................................... 4-27<br />
Table 4-11: Types of post-harvest activities undertaken by ma<strong>in</strong> types of vegetables.................. 4-27<br />
Table 4-12: Characteristics of post-harvest process<strong>in</strong>g activities by ma<strong>in</strong> type of vegetable........ 4-28<br />
Table 4-13: Types of post-harvest activities undertaken by ma<strong>in</strong> types of fruit............................ 4-29<br />
Table 4-14: Characteristics of post-harvest process<strong>in</strong>g activities by ma<strong>in</strong> type of fruit ................ 4-30<br />
Table 4-15: Characteristics of measures taken to ensure quality of raw material <strong>in</strong>puts from<br />
suppliers...................................................................................................................... 4-31<br />
Table 4-16: Characteristics of measures taken to ensure quality dur<strong>in</strong>g post-harvest<br />
process<strong>in</strong>g ................................................................................................................... 4-31<br />
Table 4-17: Ma<strong>in</strong> waste disposal methods of traders..................................................................... 4-32<br />
Table 4-18: Characteristics of visits by health <strong>and</strong> sanitary <strong>in</strong>spectors ......................................... 4-32<br />
Table 4-19: Organizations that <strong>in</strong>spected traders <strong>in</strong> 2000.............................................................. 4-33<br />
Table 4-20: Distribution of traders by gross revenue (‘000 VND) ................................................ 4-33<br />
Table 4-21: Average total value <strong>and</strong> composition of production <strong>and</strong> sales by type of<br />
produce ....................................................................................................................... 4-34<br />
Table 4-22: Characteristics of buyers plac<strong>in</strong>g orders for future delivery....................................... 4-34<br />
Table 4-23: Prevalence <strong>and</strong> characteristics of restrictions on the movement of goods.................. 4-35<br />
Table 4-24: Expected usefulness of <strong>in</strong>formation that traders do not currently have access to ...... 4-36<br />
Table 4-25: Characteristics of profitability <strong>in</strong> 2000 ....................................................................... 4-37<br />
Table 4-26: Reason for improvement <strong>in</strong> profitability of traders <strong>in</strong> 2000 ....................................... 4-37<br />
Table 5-1: Location of Processors................................................................................................ 5-25<br />
Table 5-2: Ownership structure of bus<strong>in</strong>ess by type of bus<strong>in</strong>ess ................................................. 5-25<br />
Table 5-3: Distribution of manager by gender <strong>and</strong> Size of processor.......................................... 5-26<br />
Table 5-4: Level of education of bus<strong>in</strong>ess manager by bus<strong>in</strong>ess size.......................................... 5-26<br />
Table 5-5: Use of labor by labor type (%) .................................................................................. 5-26<br />
Table 5-6: Daily labor price (‘000 VND) by labor type <strong>and</strong> size of bus<strong>in</strong>ess.............................. 5-27


