- Page 1 and 2:
WADERS AND THEIR ESTUARINE FOOD SUP
- Page 3 and 4:
plia^ohi. WADERS AND THEIR ESTUARI
- Page 5 and 6:
Waders and their estuarine food sup
- Page 7 and 8:
WADERS AND THEIR ESTUARINE FOOD SUP
- Page 10 and 11:
figuren: Dick Visser omslagfoto: Ja
- Page 12 and 13:
15 Versatility of male curlews (Num
- Page 15 and 16:
That science is making progress, ma
- Page 17 and 18:
INTRODUCTION The remnants of brushw
- Page 19 and 20:
When hcnlhic bivalves extend llien
- Page 21 and 22:
the burrow depths and on the fracti
- Page 23 and 24:
INTRODUCTION Ms,i invest 409 of (he
- Page 25 and 26:
able lo sw itch 10 oiher prey which
- Page 27 and 28:
Long-term, broadly-based research c
- Page 29 and 30:
Chapter 1 SEASONAL VARIATION IN BOD
- Page 31 and 32:
SEASONAL VARIATION IN BODY WEIGHT O
- Page 33 and 34:
Tahle 1 Weight loss ('•- ± SE) m
- Page 35 and 36:
SEASONAL VARIATION IN BODY WEIGHT O
- Page 37 and 38:
SEASONAL VARIATION IN BODY WEIGHT O
- Page 39 and 40:
i 60 50 40 30 20 10 0 • INFESTED
- Page 41 and 42:
240- SEASONAL VARIATION IN BODY WEI
- Page 43 and 44:
20 10 0 -10 -20h 2 3 4 5 6 7 8 9 se
- Page 45 and 46:
a E 400 - S. plana 35 mm 320 240 16
- Page 47 and 48:
SEASONAL VARIATION IN BODY WEIGHT O
- Page 49 and 50:
Chapter 2 HOW THE FOOD SUPPLY HARVE
- Page 51 and 52:
FOOD SUPPLY HARVESTABLE BY WADERS H
- Page 53 and 54:
Methods The study sites were situat
- Page 55 and 56:
less than that of bivalves, partly
- Page 57 and 58:
I Fig. 3). Peak condition was reach
- Page 59 and 60:
total biomass since most of those t
- Page 61 and 62:
on the basis of the preceding and t
- Page 63 and 64:
However, for obvious reasons, we ma
- Page 65 and 66:
prey. A decrease in the prey densit
- Page 67 and 68:
Tahle 2. The intake rate ol < lyste
- Page 69 and 70:
* ' % -. . ; a X - . - * • ^ •
- Page 71 and 72:
(Zwarts & Wanink 1989). In quiet we
- Page 73 and 74:
general law relating handling time
- Page 75 and 76:
nearly twice as much time (0.79 s).
- Page 77 and 78:
4 5 6 7 8 9 size class of Corophium
- Page 79 and 80:
and annually. Second, the lower siz
- Page 81 and 82:
Prey switching Waders feeding on ti
- Page 83 and 84:
autumn and spring, and the contrary
- Page 85 and 86:
where they switch to surface-living
- Page 87 and 88: Chapter 3 BURYING DEPTH OF THE BENT
- Page 89 and 90: DEPTH AND SIPHON CROPPING IN SCROBI
- Page 91 and 92: I DEPTH AND SIPHON CROPPING IN SCRO
- Page 93 and 94: DEPTH AND SIPHON CROPPING IN SCROBI
- Page 95 and 96: Table 3. Three-Way analysis Of vari
- Page 97: Chapter 4 SIPHON SIZE AND BURYING D
- Page 100 and 101: 15 20 size (mm) Fig. 3. Cerasioderm
- Page 102 and 103: 10 size (mm) SIPHON SIZE AND DEPTH
- Page 104 and 105: o, 7 01 5 | * CL 5- SIPHON SIZE AND
- Page 106 and 107: 4 Q) Si •a a. 16- 20- A predator:
- Page 108 and 109: prey risk for an animal al a depth
- Page 110 and 111: Table 6. Size al which there is a m
- Page 112 and 113: * ' 1 /-/ "».-^*«C
- Page 114 and 115: face and so expose themselves to a
- Page 116 and 117: surface in die containers was varie
- Page 118 and 119: 50 OOF 310.00 I 5.00 ^ 1.00 3=" 0.5
- Page 120 and 121: Tahle 1. Macoma and Scrobicularia.
- Page 122 and 123: siphon would not have to reach the
- Page 124 and 125: known siphon weight and burying dep
- Page 127 and 128: ACCESSIBLE PREY ARE OFTEN IN POOR C
- Page 129 and 130: 1 2 3 4 burying depth (cm) Kin. I.
- Page 131 and 132: I—1 • • : : : : ! - ! -|-r 0
- Page 133 and 134: Chapter 7 DOES AN OPTIMALLY FORAGIN
- Page 135 and 136: OPTIMAL FORAGING AND THE FUNCTIONAL
- Page 137: 100 200 300 prey density (n-m-2) Fi
- Page 141 and 142: Table 2. Results of eight iwo-wav a
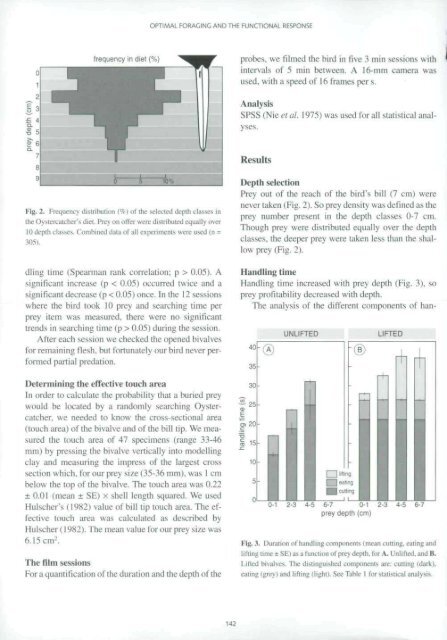
- Page 143 and 144: OPTIMAL FORAGING AND THE FUNCTIONAL
- Page 145 and 146: prey density II III Fig. 12. Freque
- Page 147 and 148: OPTIMAL FORAGING AND THE FUNCTIONAL
- Page 149: PREY SIZE SELECTION AND INTAKE RATE
- Page 152 and 153: Predicted 'passive size selection'
- Page 154 and 155: lig. 2. Larger Mussels are less ava
- Page 156 and 157: Fig. 5. Scrobicularia plana. Size c
- Page 158 and 159: and maiiv are too thick-shelled to
- Page 160 and 161: The measurements of handling time i
- Page 162 and 163: 1 2 3 4 5 6 7 probing depth (cm PRE
- Page 164 and 165: valves may vary by a factor of two
- Page 166 and 167: optimal foraging model, the minimum
- Page 168 and 169: their gut is full? Do they reduce t
- Page 171 and 172: PREY PROFITABILITY AND INTAKE RATE
- Page 173 and 174: catchers to take only certain prey
- Page 175 and 176: licult error of estimate arose if p
- Page 177 and 178: Counts of feeding and non-feeding b
- Page 179 and 180: PREY PROFITABILITY AND INTAKE RATE
- Page 181 and 182: 20 30 40 50 shell length (mm) PREY
- Page 183 and 184: PREY PROFITABILITY AND INTAKE RATE
- Page 185 and 186: Nereis Arenicola tipuia earthwo'm M
- Page 187 and 188: take rate. We might therefore expec
- Page 189 and 190:
prey species, using parallel slopes
- Page 191 and 192:
5.0 4.0 1-3.0 a & • % * • * •
- Page 193 and 194:
time during the feeding period. As
- Page 195 and 196:
winter. Similarly, handling time in
- Page 197 and 198:
5.0 - f-4.0 S 3.0 in I 20 a 2 a | 1
- Page 199 and 200:
situation arrived in the western pa
- Page 201 and 202:
PREY PROFITABILITY AND INTAKE RATE
- Page 203 and 204:
• ' • 14 PREY PROFITABILITY AND
- Page 205 and 206:
Notes lo appendix: PREY PROFITABILI
- Page 207:
Chapter 10 WHY OYSTERCATCHERS HAEMA
- Page 210 and 211:
2 4 6 8 10 time on feeding area (h)
- Page 212 and 213:
80- 60- o 80 60- 40- 20- INTAKE RAT
- Page 214 and 215:
est of bod\ behind: an estimated 22
- Page 216 and 217:
INTAKE RATE AND PROCESSING RATE IN
- Page 218 and 219:
Wanink 1993). The energy content of
- Page 220 and 221:
(7) Age All studies dealt with adul
- Page 222 and 223:
irds over long periods. As an examp
- Page 224 and 225:
Discussion There is no difference i
- Page 226 and 227:
comparison between the weight of ih
- Page 228 and 229:
. 1', L ! •
- Page 230 and 231:
Introduction PREDICTING SEASONAL AN
- Page 232 and 233:
PREDICTING SEASONAL AND ANNUAL FLUC
- Page 234 and 235:
PREDICTING SEASONAL AND ANNUAL FLUC
- Page 236 and 237:
PREDICTING SEASONAL AND ANNUAL FLUC
- Page 238 and 239:
PREDICTING SEASONAL AND ANNUAL FLUC
- Page 240 and 241:
1000 r 1 II" 1 - r^Jan'80 PREDICTIN
- Page 242 and 243:
PREDICTING SEASONAL AND ANNUAL FLUC
- Page 244 and 245:
PREDICTING SEASONAL AND ANNUAL FLUC
- Page 246 and 247:
PREDICTING SEASONAL AND ANNUAL FLUC
- Page 248 and 249:
PREDICTING SEASONAL AND ANNUAL FLUC
- Page 250 and 251:
PREDICTING SEASONAL AND ANNUAL FLUC
- Page 252 and 253:
IOO BO 60 40 20 0 PREDICTING SEASON
- Page 254 and 255:
PREDICTING SEASONAL AND ANNUAL FLUC
- Page 256 and 257:
PREDICTING SEASONAL AND ANNUAL FLUC
- Page 258 and 259:
PREDICTING SEASONAL AND ANNUAL FLUC
- Page 260 and 261:
PREDICTING SEASONAL AND ANNUAL FLUC
- Page 262 and 263:
PREDICTING SEASONAL AND ANNUAL FLUC
- Page 265 and 266:
WHY KNOT TAKE MEDIUM-SIZED MACOMA W
- Page 267 and 268:
in Zwarts & Esselink 1989). The len
- Page 269 and 270:
shell length (mm) FIR. 3. Peringia.
- Page 271 and 272:
fused, specimens larger than this w
- Page 273 and 274:
50 100- s s I — f = S. plana, n=2
- Page 275 and 276:
area is twice as large as the touch
- Page 277 and 278:
10 15 lower size threshold (mm) Fig
- Page 279 and 280:
lime (Hughes 1979). This would furt
- Page 281 and 282:
WHY KNOT TAKE MEDIUM-SIZED MACOMA T
- Page 283 and 284:
Chapter 13 ANNUAL AND SEASONAL VARI
- Page 285 and 286:
VARIATION IN FOOD SUPPLY OF KNOT AN
- Page 287 and 288:
Two sites (N and M in Fig. 2) were
- Page 289 and 290:
20 30 VARIATION IN FOOD SUPPLY OF K
- Page 291 and 292:
20 l i r'l ' i •o j^y^T n ^ ' " ^
- Page 293 and 294:
July ' Aug ' Sept Fig. 9. Proportio
- Page 295 and 296:
available. There must, however, be
- Page 297 and 298:
Chapter 14 SEASONAL TREND IN BURROW
- Page 299 and 300:
BURROWING AND FEEDING IN NEREIS SEA
- Page 301 and 302:
Table 2. Results of a 2-way analysi
- Page 303 and 304:
June 1981 June 1982 is * N.MUD •
- Page 305 and 306:
8 10 I 12 JZ 5. -g 1*» •e o i 16
- Page 307 and 308:
6 - n=!080 5 • g 4 CP > i 3 CO CD
- Page 309 and 310:
1985) and Curlew (/wails ,v, Lsseli
- Page 311:
Chapter 15 VERSATILITY OF MALE CURL
- Page 314 and 315:
Smid! 1951. Muus 1967, Wolff 1973,
- Page 316 and 317:
0.6 0.8 1.0 1.2 1.4 1.6 jaw lengih
- Page 318 and 319:
Na oi both Nrieck Fig. 7. Numenius
- Page 320 and 321:
6 8 10 12 14 16 18 worm length (cm)
- Page 322 and 323:
too (Fig. 11 A). Indeed, the averag
- Page 324 and 325:
VERSATILITY OF CURLEWS FEEDING ON N
- Page 326 and 327:
total time spent al the surface. Th
- Page 328 and 329:
2 4 . • 2.2 • 30 .-.2.0 to Q. 1
- Page 331 and 332:
PREY DEPLETION BY OYSTERCATCHER AND
- Page 333 and 334:
the rule: the observed lower limit
- Page 335 and 336:
to locate the clams after they had
- Page 337 and 338:
Curlew, by bury ing some hundreds o
- Page 339 and 340:
PREY DEPLETION BY OYSTERCATCHER AND
- Page 341 and 342:
SAMENVATTING 345
- Page 343 and 344:
Voorgeschiedenis In 1960 verscheen
- Page 345 and 346:
maken. Als gebied A een grotere voe
- Page 347 and 348:
omdat ze nog vrijwel niets wegen. l
- Page 349 and 350:
kunnen opzuigen. of diep leven en z
- Page 351 and 352:
van de uitgerekte sifo over het wad
- Page 353 and 354:
het toen niet gemakkelijk hebben ge
- Page 355 and 356:
doende nonnetjes van 10 tot 15 mm l
- Page 357 and 358:
aangevoerde voedsel en de wulp past
- Page 359 and 360:
zijn dan twee jaar en wulpen geen s
- Page 361 and 362:
was dan ook dank/ij de inzet van al
- Page 363 and 364:
REFERENCES 367
- Page 365 and 366:
Allen RL. 1983. Feeding behaviour o
- Page 367 and 368:
BreyT. 1989. Der Einfluss physikali
- Page 369 and 370:
latie tol chironoiiiiilen en de wai
- Page 371 and 372:
huch der Vogel Milteleuropas, Band
- Page 373 and 374:
llolmann II. & H. Huerschelmann 196
- Page 375 and 376:
l-cndrem D.W. 1984. Flocking, feedi
- Page 377 and 378:
Pekkarinen M. 1984. Regeneration of
- Page 379 and 380:
lion of Mussels Mytilus edulis hy O
- Page 381 and 382:
lulal Dal esiuanes: a comparison of