

waders and their estuarine food supplies - Vlaams Instituut voor de ...
waders and their estuarine food supplies - Vlaams Instituut voor de ...
waders and their estuarine food supplies - Vlaams Instituut voor de ...

You also want an ePaper? Increase the reach of your titles
YUMPU automatically turns print PDFs into web optimized ePapers that Google loves.
Two sites (N <strong>and</strong> M in Fig. 2) were selected for<br />
more <strong>de</strong>tailed observations: 146 plots of 0.1 ha were<br />
pegged out <strong>and</strong> two towers built to observe the <strong>wa<strong>de</strong>rs</strong>.<br />
The feed;- ::es were <strong>de</strong>termine;! h\ counting<br />
<strong>wa<strong>de</strong>rs</strong> in the plots every 30 min over the entire love<br />
waier period. Sites N <strong>and</strong> M were situated just below<br />
mean sea level: the clay content of the substrate was 4<br />
to 5%.<br />
Core samples of the macrozoobenthos (1/56 nr)<br />
were sieved through a I mm screen. A <strong>de</strong>tailed <strong>de</strong>scription<br />
of the procedures used to <strong>de</strong>termine ihe ash-<br />
I'rec dry weight (AFDW) is given elsewhere (Zwarts<br />
1991). Samples were taken at equally spaced intervals<br />
(200 m) along 27 transects over the entire study area in<br />
August during four years (1977 to 1980). Also. 73 or<br />
292 cores were collected from site N almost every<br />
month over the period 1980 to 1986.<br />
During the same seven years, burying <strong>de</strong>pth of Macoma<br />
was <strong>de</strong>termined once or twice a month at nearby<br />
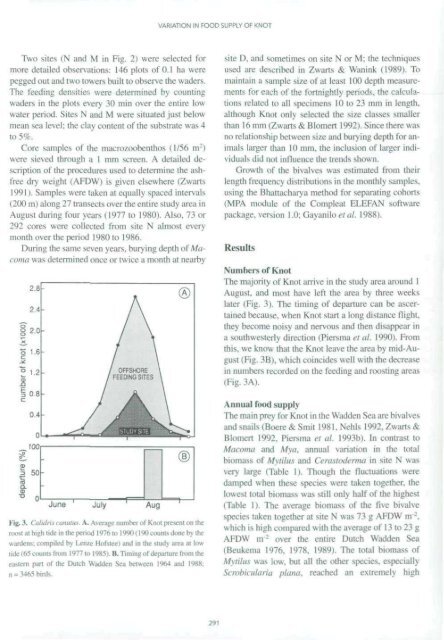
I -i-...'. Calidris ansaus A. Average number of Knot present on ihe<br />
roost at high ti<strong>de</strong> in the period 1976 to l'«()( I'K) counts done by the<br />
war<strong>de</strong>ns, compiled by Lease Hofstee) <strong>and</strong> in ihe Stud) area al low<br />
n<strong>de</strong> i 'o c. units from 1977 to 1985) B. Timing of <strong>de</strong>parture fmm the<br />
eastern pan of ihe Dutch Wad<strong>de</strong>n Sea between I9*S4 <strong>and</strong> 1988:<br />
- birds.<br />
VARIATION IN FOOD SUPPLY OF KNOT<br />
291<br />
site D. <strong>and</strong> sometimes on site N or M: the techniques<br />
used are <strong>de</strong>scribed in Zwarts & Wanink (1989). To<br />
maintain a sample size of at least 100 <strong>de</strong>pth measurements<br />
for each of the fortnightl' periods, the calculations<br />
related to all specimens 10 to 23 mm in length,<br />
although Knot only selected the size classes smaller<br />
than 16 mm (Zwarts & Blomen 1992). Since there was<br />
no relationship between si/e <strong>and</strong> burying <strong>de</strong>pth for animals<br />
larger than 10 mm. ihe inclusion of larger indiv<br />
iduals did not influence the (raids shown.<br />
Growth of the bivalves was estimated from <strong>their</strong><br />
length frequency distributions in the monthly samples,<br />
using the Bhattacharya method for separating cohorts<br />
(MPA module of ihe Compleat ELEFAN software<br />
package, version 1.0: Gayaniloe/a/. 1988).<br />
Results<br />
Numbers of Knot<br />
The majority of Knot arrive in the study area around 1<br />
August, <strong>and</strong> most have left the area by three weeks<br />
later (Kg. 3). The timing of <strong>de</strong>parture can be ascertained<br />
because, when Knot start a long distance flight,<br />
Ihey become noisy <strong>and</strong> nervous <strong>and</strong> then disappear in<br />
a southwesterly direction (Piersma et al. 1990). From<br />
this, we know that ihe Knol leave the area by mid-August<br />
(Fig. 3B), which coinci<strong>de</strong>s well with the <strong>de</strong>crease<br />
in numbers recor<strong>de</strong>d on the feeding <strong>and</strong> roosting areas<br />
(Fig. 3A).<br />
Annual <strong>food</strong> supply<br />
The main prey for Knot in the Wad<strong>de</strong>n Sea are biv alves<br />
<strong>and</strong> snails (Boere & Smit 1981. Nehls 1992. Zwarts &<br />
Blomert 1992. Piersma et al. 1993b). In contrast lo<br />
Macoma <strong>and</strong> Mya. annual variation in ihe total<br />
biomass ol" Myliltis <strong>and</strong> Cerasto<strong>de</strong>rma in site N was<br />
very large (Table 1). Though the fluctuations were<br />
damped when these species were taken together, the<br />
lowest total biomass was still only half of the highest<br />
(Table 1). The average biomass of the five bivalve<br />
species taken together at site N was 73 g AFDW in \<br />
which is high compared with the average of 13 to 23 g<br />
AFDW nr 2 over the entire Dutch Wad<strong>de</strong>n Sea<br />
i Beukema 1976. 1978. 1989). The total hiom.i<br />
Mytilus was low. but all the other species, especially<br />
Scrobicularia plana, reached an extremely high


