

waders and their estuarine food supplies - Vlaams Instituut voor de ...
waders and their estuarine food supplies - Vlaams Instituut voor de ...
waders and their estuarine food supplies - Vlaams Instituut voor de ...

Create successful ePaper yourself
Turn your PDF publications into a flip-book with our unique Google optimized e-Paper software.
take rate is to be expected. Oystercatchers have to raise<br />
<strong>their</strong> daily consumption to cover the increased thermoregulation<br />
costs when winter temperatures drop below<br />
the critical level of 10 °C. Hence, to keep <strong>their</strong><br />
body weight constant, they must raise <strong>their</strong> intake rate<br />
<strong>and</strong>/or extend <strong>their</strong> feeding period. Since intake rate is<br />
highly correlated with the time spent on ihe feeding<br />
area (Zwarts et ul. 1996b), we exclu<strong>de</strong> in this analysis<br />
the intake rates of breeding birds visiting the feeding<br />
areas only during short intervals (< I h).<br />
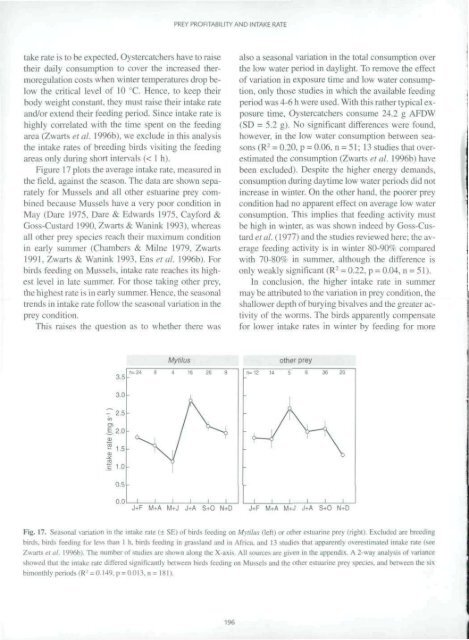
Figure 17 plots the average intake rate, measured in<br />
the field, againsi the season. The data arc shown separately<br />
for Mussels <strong>and</strong> all other <strong>estuarine</strong> prev combined<br />
because Mussels have a very poor condition in<br />
May (Dare 1975. Dare & Edwards 1975, Cayford &<br />
Goss-Custard 1990. Zwarts & Wanink 1993). whereas<br />
all other prey species reach <strong>their</strong> maximum condition<br />
in early summer (Chambers & Milne 1979, Zwarts<br />
1991. Zwarts & Wanink 1993. Ens et al. 1996b). For<br />
birds feeding on Mussels, intake rate reaches its highest<br />
level in late summer. For those taking other prey,<br />
the highest rate is in early summer. Hence, the seasonal<br />
trends in intake rate follow the seasonal variation in the<br />
prey condition.<br />
This raises the question as to whether there was<br />
35<br />
3 0<br />
- 2.5<br />
in<br />
CTl<br />
£.2.0<br />
D<br />
a 1.5<br />
S<br />
ii.o<br />
0.5<br />
0.0<br />
PREY PROFITABILITY AND INTAKE RATE<br />
also a seasonal variation in the total consumption over<br />
the low water period in daylight. To remove the effect<br />
of variation in exposure time <strong>and</strong> low water consumption,<br />
only those studies in which the available feeding<br />
period was 4-6 h were used. With this rather typical exposure<br />
time. Oystercatchers consume 24.2 g AFDW<br />
(SD = 5.2 g). No significant differences were found.<br />
however, in the low water consumption between seasons<br />
(R : = 0.20. p • 0.06. n = 51: 13 studies that overestimated<br />
the consumption (Zwarts el al. 1996b) have<br />
been exclu<strong>de</strong>d). Despite the higher energy <strong>de</strong>m<strong>and</strong>s.<br />
consumption during daytime low water periods did not<br />
increase in winter. On the other h<strong>and</strong>, the poorer prey<br />
condition had no apparent effeel on average low water<br />
consumption. This implies that feeding activity must<br />
be high in winter, as was shown in<strong>de</strong>ed by Goss-Custard<br />
et al. (1977) <strong>and</strong> the studies reviewed here; the average<br />
feeding activity is in winter 80-90'.' compared<br />
with 70-80% in summer, although the difference is<br />
only weakly significant (R 2 = 0.22. p = 0.04. n = 51).<br />
In conclusion, the higher intake rate in summer<br />
may be attributed to the variation in prey condition, the<br />
shallower <strong>de</strong>pth of burying bivalves <strong>and</strong> the greater activity<br />
of the worms. The birds apparently compensate<br />
for lower intake rates in winter by feeding for more<br />
Mytilus other prey<br />
n=24 9 i 16 26 9 n= 12 14 5 6 36 20<br />
_ J I 1 1 L<br />
J+F M+A M+J J+A S+O N-fD J-fF M+A M+J J-t-A S+O N+D<br />
Fin. 17. Seasonal variation in the iniake rate I± SE) of buds feeding on Mytilus i left i or oilier csiuarine prey (right). Exclu<strong>de</strong>d are breeding<br />
hirds. birds feeding lor less than I h. birds feeding in grassl<strong>and</strong> <strong>and</strong> in Africa, <strong>and</strong> 13 sludies lhat apparently overestimated iniake rate (see<br />
Zwarts ei al. I'Wib). The number ol sludies .ire shown along the X-axis. All sources are given in the appendix. A 2-wav analysis ol variance<br />
showed ili.il ihe intake rale differed significantly between birds leeding on Mussels <strong>and</strong> the other <strong>estuarine</strong> prev species, <strong>and</strong> between the six<br />
bimonthly periods IR- = I). 14y. p = 0.013. n = IX11.<br />
196


