

waders and their estuarine food supplies - Vlaams Instituut voor de ...
waders and their estuarine food supplies - Vlaams Instituut voor de ...
waders and their estuarine food supplies - Vlaams Instituut voor de ...

Create successful ePaper yourself
Turn your PDF publications into a flip-book with our unique Google optimized e-Paper software.
CanutoOermi<br />
5 10 15 20 25<br />
profitability (mg s-' h<strong>and</strong>ling)<br />
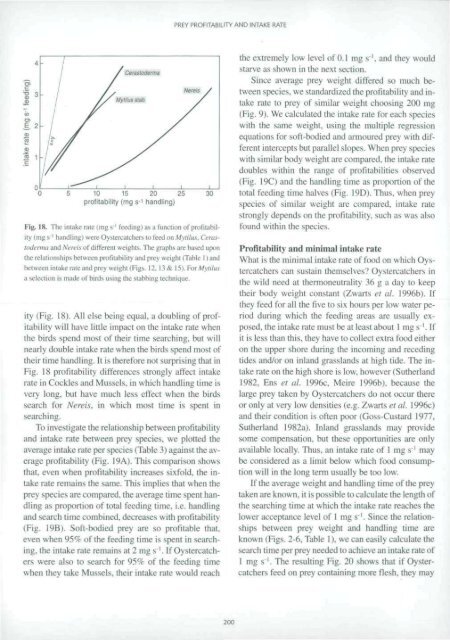
Fig, IS. The intake rate (mg s ' (coding) as a function ot profitability<br />
(mgs' 1 h<strong>and</strong>ling) woeOynercatdtera to feed on Mytilus, I eras<br />
to<strong>de</strong>rma <strong>and</strong> Nereis of differenl weights. The graphs are based upon<br />
the relationships between profitability <strong>and</strong> prey weight (Table I) <strong>and</strong><br />
between intake rate <strong>and</strong> pre) weight (Figs, 12, \s& 15). Pot Mytilus<br />
a Selection is ma<strong>de</strong> of birds using ilic slabbing technique.<br />
ity (Fig. 18). All else being equal, a doubling of profitability<br />
will have little impact on the intake rate when<br />
the birds spend most of <strong>their</strong> time searching, but will<br />
nearly double intake rate when the birds spend most of<br />
<strong>their</strong> time h<strong>and</strong>ling. It is therefore not surprising that in<br />
Fig. 18 profitability differences strongly affect intake<br />
rate in Cockles <strong>and</strong> Mussels, in which h<strong>and</strong>ling lime is<br />
very long, but have much less effect when the birds<br />
search for Nereis, in which most time is spent in<br />
searching.<br />
To investigate the relationship between profitability<br />
<strong>and</strong> intake rate between prey species, we plotted the<br />
average intake rate per species (Table 3) againsi ihe average<br />
profitability (Fig. 19A). This comparison shows<br />
lhat. even when profitability increases sixfold, the intake<br />
rate remains the same. This implies that when the<br />
prey species are compared, the average lime spent h<strong>and</strong>ling<br />
as proportion of total feeding time, i.e. h<strong>and</strong>ling<br />
<strong>and</strong> search time combined, <strong>de</strong>creases with profitability<br />
(Fig. I9B). Soft-bodied prey are so profitable that.<br />
even when 959?- of the feeding time is spent in searching,<br />
the intake rate remains at 2 mg s'. If Oystercatchers<br />
were also to search for 95% of the feeding lime<br />
when they take Mussels, <strong>their</strong> intake rate would reach<br />
PREY PROFITABILITY AND INTAKE RATE<br />
30<br />
200<br />
the extremely low level of 0.1 mg s '. <strong>and</strong> they would<br />
starve as shown in the next section.<br />
Since average prey weighl differed so much be-<br />
Ivveen species, we st<strong>and</strong>ardized the profitability <strong>and</strong> intake<br />
rate to prey of similar weight choosing 2(X) mg<br />
(Fig. 9). We calculated ihe intake rate for each species<br />
with the same weight, using the multiple regression<br />
equations for soft-bodied <strong>and</strong> armoured prey with different<br />
intercepts but parallel slopes. When prey species<br />
with similar body weight are compared, the intake rate<br />
doubles within the range of profitabilities observed<br />
(Fig. 19C) <strong>and</strong> the h<strong>and</strong>ling time as proportion of the<br />
total feeding time halves (Fig. 19D). Thus, when prey<br />
species of similar weight are compared, iniake rale<br />
strong I v <strong>de</strong>pends on the profitability, such as was also<br />
found within the species.<br />
Profitability <strong>and</strong> minimal intake rate<br />
What is the minimal intake rate of <strong>food</strong> on which Oystercatchers<br />
can sustain themselves? Oystercatchers in<br />
the wild need at thermoneutmlity 36 g a day to keep<br />
<strong>their</strong> body weighl constant (Zwarts et al. 1996b). If<br />
they feed for all the five to six hours per low water period<br />
during which the feeding areas are usually exposed,<br />
the intake rate must be at least about 1 mg s '. If<br />
it is less than this, they have to collect extra <strong>food</strong> either<br />
on the upper shore during (he incoming <strong>and</strong> receding<br />
ti<strong>de</strong>s <strong>and</strong>/or on inl<strong>and</strong> grassl<strong>and</strong>s al high ti<strong>de</strong>. The iniake<br />
raie on ihe high shore is low. however (Sutherl<strong>and</strong><br />
1982, Ens et at. 1996c, Meire 1996b). because the<br />
huge prey taken by Oystercatchers do not occur there<br />
or only at very low <strong>de</strong>nsities (e.g. Zwarts et al. 1996c)<br />
<strong>and</strong> <strong>their</strong> condition is often poor (Goss-Custard 1977,<br />
Sutherl<strong>and</strong> 1982a). Inl<strong>and</strong> grassl<strong>and</strong>s may provi<strong>de</strong><br />
some compensation, but these opportunities are only<br />
available locally. Thus, an intake rale of 1 mg s ' may<br />
be consi<strong>de</strong>red as a limit below which <strong>food</strong> consumpiion<br />
will in the long term usually be too low.<br />
If the average weight <strong>and</strong> h<strong>and</strong>ling time of the prey<br />
taken are known, it is possible to calculate the lengih of<br />
the searching time at which the intake rate reaches the<br />
lower acceptance level of 1 mg s~*. Since the relationships<br />
between prey weight <strong>and</strong> h<strong>and</strong>ling time are<br />
known (Figs. 2-6. Table 1). we can easily calculate the<br />
search time per prev nee<strong>de</strong>d to achieve an intake rate of<br />
I mg s '. The resulting Fig. 20 shows that if Oystercatchers<br />
feed on prey containing more flesh, they may


