waders and their estuarine food supplies - Vlaams Instituut voor de ...
waders and their estuarine food supplies - Vlaams Instituut voor de ...
waders and their estuarine food supplies - Vlaams Instituut voor de ...
You also want an ePaper? Increase the reach of your titles
YUMPU automatically turns print PDFs into web optimized ePapers that Google loves.
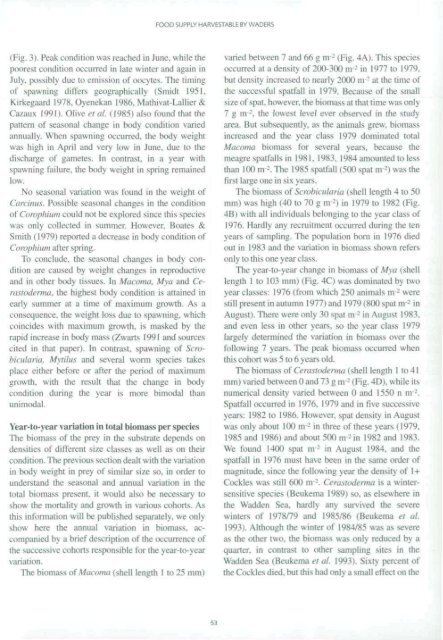
I Fig. 3). Peak condition was reached in June, while the<br />
poorest condition occurred in late winter <strong>and</strong> again in<br />
July, possibly due to emission of oocytes. The timing<br />
of spawning differs geographically (Smidt 1951.<br />
Kirkegaard 1978, Oyenekan l986,Mathivat-Lallier&<br />
Ca/aux 1991). Olive et al i 1985) also found that ihe<br />
pattern of seasonal change in body condition varied<br />
annually. When spawning occurred, the body weight<br />
was high in April <strong>and</strong> very low in June, due to the<br />
discharge ol gametes. In contrast, in a year wilh<br />
spawning failure, the body weight in spring remained<br />
low.<br />
No seasonal variation was found in the weight of<br />
Carcinus. Possible seasonal changes in the condition<br />
of Corophium could not be explored since this species<br />
was only collected in summer. However. Boates &<br />
Smith (1979) reported a <strong>de</strong>crease in body condition of<br />
Corophium after spring.<br />
To conclu<strong>de</strong>, the seasonal changes in body condition<br />
are caused by weight changes in reproductive<br />
<strong>and</strong> in other body tissues. In Macoma. Mya <strong>and</strong> Cera<br />
sin<strong>de</strong>rma. the highest body condition is attained in<br />
early summer at a time of maximum growth. As a<br />
consequence, the weight loss due to spawning, which<br />
coinci<strong>de</strong>s with maximum growth, is masked by the<br />
rapid increase in body mass (Zwarts 1991 <strong>and</strong> .sources<br />
cited in that paper). In contrast, spawning of Scrobicularia.<br />
Mytilus <strong>and</strong> several worm species takes<br />
place either before or after the period of maximum<br />
growth, with the result that the change in body<br />
condition during the year is more bimodal than<br />
unimodal.<br />
Year-to-year variation in total biomass per species<br />
The biomass of the prey in the substrate <strong>de</strong>pends on<br />
<strong>de</strong>nsities Of different size classes as well as on <strong>their</strong><br />
condition. The previous section <strong>de</strong>alt with the variation<br />
in body weight in prey of similar size so. in or<strong>de</strong>r to<br />
un<strong>de</strong>rst<strong>and</strong> Ihe seasonal <strong>and</strong> annual variation in the<br />
total biomass present, it would also be necessary to<br />
show the mortality <strong>and</strong> growth in various cohorts. As<br />
ihis information will be published separately, we only<br />
show here the annual variation in biomass, accompanied<br />
by a brief <strong>de</strong>scription of the occurrence of<br />
the successive cohorts responsible for the year-to-year<br />
variation.<br />
The biomass ot Macoma (shell length I to 25 mm)<br />
FOOD SUPPLY HARVESTABLE BY WADERS<br />
53<br />
varied between 7 <strong>and</strong> 66 g nr 2 (Fig. 4A). This species<br />
occurred at a <strong>de</strong>nsity of 200-300 in-' in 1977 to 1979,<br />
but <strong>de</strong>nsity increased to nearly 2(XXJ nr 2 at the time of<br />
the successful spat fall in 1979. Because of the small<br />
size of spat, however, the biomass at that time was only<br />
7 g m : . the lowest level ever observed in ihe study<br />
area. But subsequently, as the animals grew, biomass<br />
increased <strong>and</strong> the year class 1979 dominated total<br />
Macoma biomass for several years, because the<br />
meagre spatfalls in 1981. 1983. 1984 amounted to less<br />
than KH) m -. The 1985 spatlall (500 spat in 'l was the<br />
first large one in si\ v cars.<br />
The biomass oi Scrobicularia (shell length 4 to 50<br />
mm) was high (40 to 70 g m* 2 ) in 1979 to 1982 (Fig.<br />
4B) with all individuals belonging to the year class of<br />
1976. Hardly any recruitment occurred during the len<br />
years of sampling. The population born in 1976 died<br />
out in 1983 <strong>and</strong> the variation in biomass shown relets<br />
only lo this one year class.<br />
The year-to-year change in biomass of Mya (shell<br />
length 1 to 103 mm) (Fig. 4C) was dominated by two<br />
year classes: 1976 (from which 250 animals m 2 were<br />
still present in autumn 1977) <strong>and</strong> 1979 (800 spat nr 2 in<br />
August) There were only JO spat nr 2 in August 1983<br />
<strong>and</strong> even less in other years, so the year class 1979<br />
largely <strong>de</strong>termined the variation in biomass over the<br />
following 7 years. The peak biomass occurred when<br />
this cohort was 5 to 6 years old.<br />
The biomass of Cerasto<strong>de</strong>rma I shell length I to 41<br />
mm) varied between 0 <strong>and</strong> 73 g m 2 (Fig 4D), w lule its<br />
numerical <strong>de</strong>nsity varied between 0 <strong>and</strong> 1550 n m -'.<br />
Spatfall occurred in 1976. 1979 <strong>and</strong> in live successive<br />
years: 1982 to 1986. However, spat <strong>de</strong>nsity in August<br />
was only about 1(X) nr : in three of these years i 1979.<br />
1985 <strong>and</strong> 1986) <strong>and</strong> about 500 nr 2 in 1982 <strong>and</strong> 1983.<br />
We found 1400 spat m 2 in August 1984. <strong>and</strong> the<br />
spatlall in 1976 must have been in the same or<strong>de</strong>r of<br />
magnitu<strong>de</strong>, since Ihe following year the <strong>de</strong>nsity of 1+<br />
Cockles was still 600 nr 2 . Cerasto<strong>de</strong>rma is a w intersensitive<br />
species (Beukema 1989) so, as elsewhere in<br />
the Wad<strong>de</strong>n Sea. hardly any survived the severe<br />
winters of 1978/79 <strong>and</strong> 1985/86 (Beukema et al.<br />
1993). Although the winter of 1984/85 was as severe<br />
as the other two. the biomass was only reduced by a<br />
quarter, in contrast to other sampling sites in the<br />
Wad<strong>de</strong>n Sea (Beukema ei al. 1993), Sixty percent of<br />
the Cockles died, but this had onlv a small effect on the


