

waders and their estuarine food supplies - Vlaams Instituut voor de ...
waders and their estuarine food supplies - Vlaams Instituut voor de ...
waders and their estuarine food supplies - Vlaams Instituut voor de ...

Create successful ePaper yourself
Turn your PDF publications into a flip-book with our unique Google optimized e-Paper software.
PREDICTING SEASONAL AND ANNUAL FLUCTUATIONS IN THE LOCAL EXPLOITION OF DIFFERENT PREY<br />
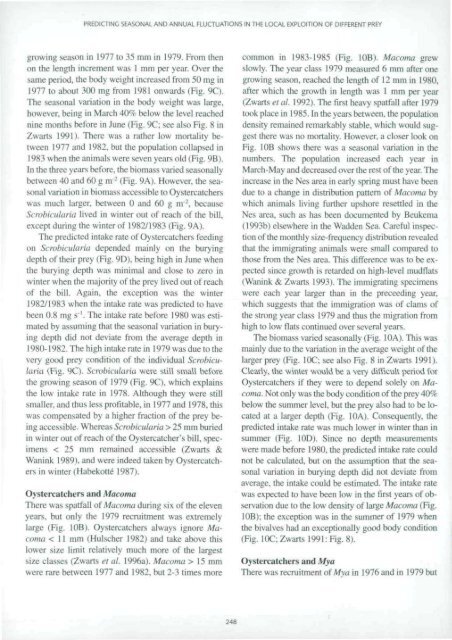
growing season in 1977 to 35 mm in 1979. From then<br />
on the length increment was 1 mm per year. Over the<br />
same period, the body weight increased from 50 mg in<br />
1977 to about 300 mg from 1981 onwards (Fig. 9C).<br />
The seasonal variation in the body weight was large,<br />
however, being in March 40% below the level reached<br />
nine months before in June (Fig. 9C; see also Fig. 8 in<br />
Zwarts 1991). There was a rather low mortality between<br />
1977 <strong>and</strong> 1982. but the population collapsed in<br />
1983 when the animals were seven years old (Fig. 9B).<br />
In the three years before, the biomass varied seasonally<br />
between 40 <strong>and</strong> 60 g ta" 2 (Fig. 9A). However, the seasonal<br />
variation in biomass accessible to Oystercatchers<br />
was much larger, between 0 <strong>and</strong> 60 g nr 2 , because<br />
Scrobicularia lived in winter out of reach of the bill,<br />
except during Ihe winter of 1982/1983 (Fig. 9A).<br />
The predicted intake rate of Oystercatchers feeding<br />
on Scrobicularia <strong>de</strong>pen<strong>de</strong>d mainly on the burying<br />
<strong>de</strong>pth of <strong>their</strong> prey (Fig. 9D). being high in June when<br />
the burying <strong>de</strong>pth was minimal <strong>and</strong> close to zero in<br />
winter when the majority of the prey lived out of reach<br />
of the bill. Again, the exception was the winter<br />
1982/1983 when the intake rate was predicted to have<br />
been 0.8 mg s' 1 . The intake rate before 1980 was estimated<br />
by assuming thai (he seasonal variation in burying<br />
<strong>de</strong>pth did not <strong>de</strong>viate from the average <strong>de</strong>pth in<br />
1980-1982. The high intake rate in 1979 was due to the<br />
very good prey condition of the individual Scrobicularia<br />
(Fig. 9C). Scrobicularia were still small before<br />
ihe growing season of 1979 (Fig. 9C). which explains<br />
the low intake rate in 1978. Although they were still<br />
smaller, <strong>and</strong> thus less profitable, in 1977 <strong>and</strong> 1978, this<br />
was compensated by a higher fraction of the prey being<br />
accessible. Whereas Scrobicularia > 25 mm buried<br />
in winter out of reach of the Oystercatcher's bill, specimens<br />
< 25 mm remained accessible (Zwarts &<br />
Wanink 1989). <strong>and</strong> were in<strong>de</strong>ed taken by Oystercalchers<br />
in winter (Habekotte 1987).<br />
Oystercatchers <strong>and</strong> Macoma<br />
There was spatfall of Macoma during six of the eleven<br />
years, but only the 1979 recruitment was extremely<br />
large (Fig. 10B). Oystercatchers always ignore Macoma<br />
< 11 mm (Hulscher 1982) <strong>and</strong> take above this<br />
lower size limit relatively much more of the largest<br />
si/e classes i/warts et al. 1996a). Macoma > 15 mm<br />
were rare between 1977 <strong>and</strong> 1982. but 2-3 times more<br />
248<br />
common in 1983-1985 (Fig. I0B). Macoma grew<br />
slowly. The year class 1979 measured 6 mm after one<br />
growing season, reached the length of 12 mm in 1980,<br />
after which the growth in length was 1 mm per year<br />
(Zwarts et al. 1992). The first heavy spatfall after 1979<br />
took place in 1985. In the years between, the population<br />
<strong>de</strong>nsity remained remarkably stable, which would suggest<br />
there was no mortality. However, a closer look on<br />
Fig. 10B shows there was a seasonal variation in the<br />
numbers. The population increased each year in<br />
March-May <strong>and</strong> <strong>de</strong>creased over the rest of the year. The<br />
increase in the Nes area in early spring must have been<br />
due to a change in distribution pattern of Macoma by<br />
which animals living further upshore resettled in the<br />
Nes area, such as has been documented by Beukema<br />
(1993b) elsewhere in the Wad<strong>de</strong>n Sea. Careful inspection<br />
of the monthly size-frequency distribution revealed<br />
that the immigrating animals were small compared to<br />
those from the Nes area. This difference was to be expected<br />
since growth is retar<strong>de</strong>d on high-level mudflats<br />
(Wanink & Zwarts 1993). The immigrating specimens<br />
were each year larger than in the preceeding year,<br />
which suggests that the immigration was of clams of<br />
the strong year class 1979 <strong>and</strong> thus the migration from<br />
high to low flats continued over several years.<br />
The biomass varied seasonally (Fig. 10A). This was<br />
mainly due to the variation in the average weight of the<br />
larger prey (Fig. IOC; see also Fig. 8 in Zwarts 1991).<br />
Clearly, the winter would be a very difficult period for<br />
Oystercatchers if they were to <strong>de</strong>pend solely on Macoma.<br />
Not only was the body condition of the prey 40%<br />
below the summer level, but me prey also had to be located<br />
at a larger <strong>de</strong>pth (Fig. 10A). Consequently, the<br />
predicted intake rate was much lower in winter than in<br />
summer (Fig. I0D). Since no <strong>de</strong>pth measurements<br />
were ma<strong>de</strong> before 1980. the predicted intake rate could<br />
not be calculated, but on the assumption that the seasonal<br />
variation in burying <strong>de</strong>pth did not <strong>de</strong>viate from<br />
average, the intake could be estimated. The intake rate<br />
was expected lo have been low in the first years of observation<br />
due to the low <strong>de</strong>nsity of large Macoma (Fig.<br />
10B); the exception was in the summer of 1979 when<br />
the bivalves had an exceptionally good body condition<br />
(Fig. 10C; Zwarts 1991: Fig. 8).<br />
Oystercatchers <strong>and</strong> Mya<br />
There was recruitment of Mya in 1976 <strong>and</strong> in 1979 but


