Using ArcCatalog
Using ArcCatalog
Using ArcCatalog

Create successful ePaper yourself
Turn your PDF publications into a flip-book with our unique Google optimized e-Paper software.
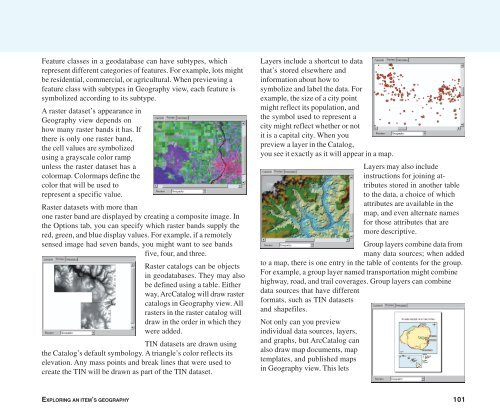
Feature classes in a geodatabase can have subtypes, which<br />
represent different categories of features. For example, lots might<br />
be residential, commercial, or agricultural. When previewing a<br />
feature class with subtypes in Geography view, each feature is<br />
symbolized according to its subtype.<br />
A raster dataset’s appearance in<br />
Geography view depends on<br />
how many raster bands it has. If<br />
there is only one raster band,<br />
the cell values are symbolized<br />
using a grayscale color ramp<br />
unless the raster dataset has a<br />
colormap. Colormaps define the<br />
color that will be used to<br />
represent a specific value.<br />
Raster datasets with more than<br />
one raster band are displayed by creating a composite image. In<br />
the Options tab, you can specify which raster bands supply the<br />
red, green, and blue display values. For example, if a remotely<br />
sensed image had seven bands, you might want to see bands<br />
five, four, and three.<br />
Raster catalogs can be objects<br />
in geodatabases. They may also<br />
be defined using a table. Either<br />
way, <strong>ArcCatalog</strong> will draw raster<br />
catalogs in Geography view. All<br />
rasters in the raster catalog will<br />
draw in the order in which they<br />
were added.<br />
TIN datasets are drawn using<br />
the Catalog’s default symbology. A triangle’s color reflects its<br />
elevation. Any mass points and break lines that were used to<br />
create the TIN will be drawn as part of the TIN dataset.<br />
Layers include a shortcut to data<br />
that’s stored elsewhere and<br />
information about how to<br />
symbolize and label the data. For<br />
example, the size of a city point<br />
might reflect its population, and<br />
the symbol used to represent a<br />
city might reflect whether or not<br />
it is a capital city. When you<br />
preview a layer in the Catalog,<br />
you see it exactly as it will appear in a map.<br />
Layers may also include<br />
instructions for joining attributes<br />
stored in another table<br />
to the data, a choice of which<br />
attributes are available in the<br />
map, and even alternate names<br />
for those attributes that are<br />
more descriptive.<br />
Group layers combine data from<br />
many data sources; when added<br />
to a map, there is one entry in the table of contents for the group.<br />
For example, a group layer named transportation might combine<br />
highway, road, and trail coverages. Group layers can combine<br />
data sources that have different<br />
formats, such as TIN datasets<br />
and shapefiles.<br />
Not only can you preview<br />
individual data sources, layers,<br />
and graphs, but <strong>ArcCatalog</strong> can<br />
also draw map documents, map<br />
templates, and published maps<br />
in Geography view. This lets<br />
EXPLORING AN ITEM’S GEOGRAPHY 101