Using ArcCatalog
Using ArcCatalog
Using ArcCatalog

You also want an ePaper? Increase the reach of your titles
YUMPU automatically turns print PDFs into web optimized ePapers that Google loves.
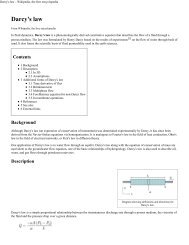
Maps, layers, and graphs<br />
You can access maps, layers, and graphs from <strong>ArcCatalog</strong>. A map<br />
is essentially a printed map stored on disk. It can contain<br />
geographic data, titles, legends, and North arrows. You can use<br />
custom map templates to create a series of maps with the same<br />
layout. You can also embed map documents in other documents—for<br />
example, in Microsoft Word. Published maps can<br />
make your work available to a wider audience by letting people<br />
interact with and print your maps using ArcReader.<br />
Layers include symbology, display, label, query, and relationship<br />
information, all of which define how geographic data is drawn on<br />
a map. For example, a layer might select specific cities from a<br />
shapefile, draw them as blue squares, and label them with text<br />
stored in a related table. Layers don’t include the data itself; they<br />
reference data sources stored elsewhere.<br />
Layers can be stored either inside a map document or as individual<br />
layer files. They are an effective communication tool that<br />
can be shared in an organization. For example, you can place<br />
predefined layers in a shared folder on the network. By using<br />
those layers, others can add data to their maps without having to<br />
know where the geographic data is stored, how to join it to a<br />
related table, or what each column means.<br />
Several layers can be combined to form a group layer. When<br />
added to a map, all layers in the group will be represented by one<br />
entry in the table of contents. For example, you might create a<br />
group layer representing the background material for a map.<br />
Similarly, you could combine road, railroad, and ferry shapefiles<br />
into a single transportation theme.<br />
In ArcMap, you can create graphs illustrating the attributes of<br />
features or records in a table. For example, your graph could<br />
illustrate population density within the regions that appear on the<br />
map. By saving a graph to a file you can add graphs with the<br />
same format to a series of maps. When added to a map, the graph<br />
establishes a link to the data and will change dynamically to<br />
reflect the currently selected features or records.<br />
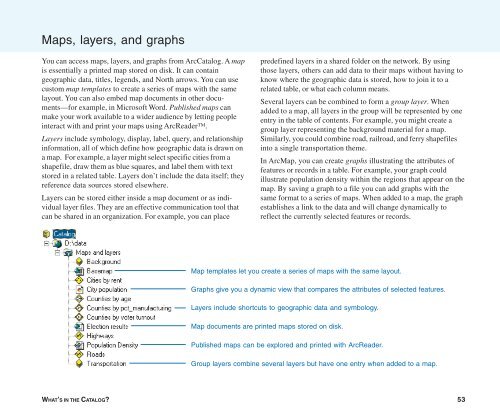
Map templates let you create a series of maps with the same layout.<br />
Graphs give you a dynamic view that compares the attributes of selected features.<br />
Layers include shortcuts to geographic data and symbology.<br />
Map documents are printed maps stored on disk.<br />
Published maps can be explored and printed with ArcReader.<br />
Group layers combine several layers but have one entry when added to a map.<br />
WHAT’S IN THE CATALOG? 53