
You also want an ePaper? Increase the reach of your titles
YUMPU automatically turns print PDFs into web optimized ePapers that Google loves.
Table 32. Range of pod damage to pigeonpeas caused by different pests in samples collected from various<br />
states of India (1975-1977).<br />
Lcpidopterous<br />
borers<br />
(H. armigera,<br />
Species<br />
Bruchids<br />
(Calloso-<br />
E. atomosa; Podfly bruchus Hymenoptera Actual pod<br />
State Maruca (Melanagro- chinensis; (Taraostig- damage by<br />
testulalis) myza obtusa) C. maculatus) modes sp.) insects<br />
(%) (%)<br />
Uttar Pradesh 2.6-12.3 9.9-36.0 0 - 0 . 2 0 - 0.2 15.5-48.7<br />
Bihar 3.1-31.3 8.5-56.3 0 - 0.7 Below 1.0 15.5-70.6<br />
Orissa 11.8-28.2 23.5-28.1 1.0- 4.4 0.2- 1.9 37.5-52.4<br />
Andhra Pradesh 15.3-67.9 1.1-14.6 0 -22.2 0 -34.3 18.2-71.4<br />
Maharashtra 10.9-83.5 1.8-44.3 0 - 1 . 4 15.5-84.6<br />
Karnataka 3.1-81.1 2.4-19.7 0.9-43.8 0.5-54.1 27.3-88.3<br />
Tamil Nadu 12.4-73.7 0.6-32.6 1.1-46.6 0.7- 4.7 26.1-81.5<br />
plasm for total protein content, and conducting<br />
studies on techniques for estimating protein and<br />
some of the limiting amino acids. These studies<br />
are essential for identifying rapid and economical<br />
procedures that will be needed for implementing<br />
a breeding program for higher quality.<br />
Comparison of Methods of Protein<br />
Estimation<br />
The Kjeldahl method of estimating total nitrogen<br />
is considered to be the standard method. The<br />
M K J (micro-Kjeldahl) method gives very similar<br />
results, and we have used it as a standard method<br />
in our studies. We also use the T A A (Technicon<br />
Auto Analyzer) and DBC (dye-binding capacity)<br />
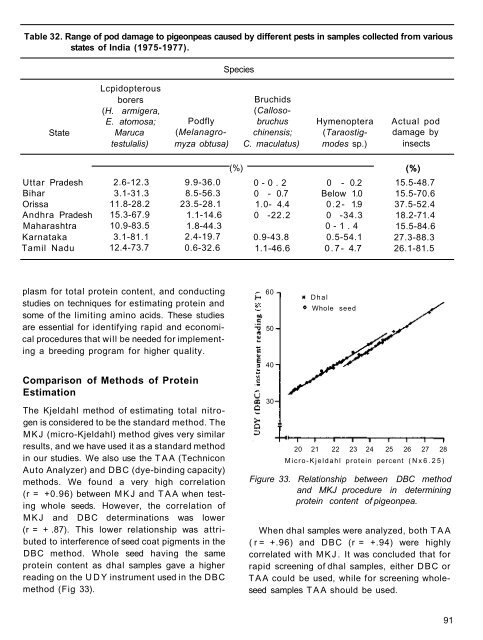
methods. We found a very high correlation<br />
(r = +0.96) between M K J and T A A when testing<br />
whole seeds. However, the correlation of<br />
M K J and DBC determinations was lower<br />
(r = + .87). This lower relationship was attributed<br />
to interference of seed coat pigments in the<br />
DBC method. Whole seed having the same<br />
protein content as dhal samples gave a higher<br />
reading on the U D Y instrument used in the DBC<br />
method (Fig 33).<br />
60<br />
50<br />
40<br />
30<br />
D h a l<br />
Whole seed<br />
20 21 22 23 24 25 26 27 28<br />
M i c r o - K j e l d a h l protein percent ( N x 6 . 2 5 )<br />
Figure 33. Relationship between DBC method<br />
and MKJ procedure in determining<br />
protein content of pigeonpea.<br />
When dhal samples were analyzed, both T A A<br />
( r = +.96) and DBC (r = +.94) were highly<br />
correlated with M K J . It was concluded that for<br />
rapid screening of dhal samples, either DBC or<br />
T A A could be used, while for screening wholeseed<br />
samples T A A should be used.<br />
91