
You also want an ePaper? Increase the reach of your titles
YUMPU automatically turns print PDFs into web optimized ePapers that Google loves.
450<br />
400<br />
350<br />
300<br />
250<br />
200<br />
150<br />
100<br />
50<br />
0<br />
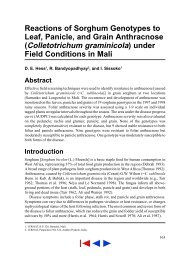
Figure 52.<br />
120<br />
100<br />
80<br />
60<br />
40<br />
20<br />
0<br />
Jun Jul Aug Sep Oct<br />
Monthly rainfall at ICRISAT Center,<br />
1972-1976.<br />
R a i n f a l l i n t e n s i t y<br />
> 3 0 mm/hr<br />
T o t a l r a i n f a l l<br />
> 25 mm<br />
1974<br />
1973<br />
1975<br />
Normal<br />
1972<br />
1976<br />
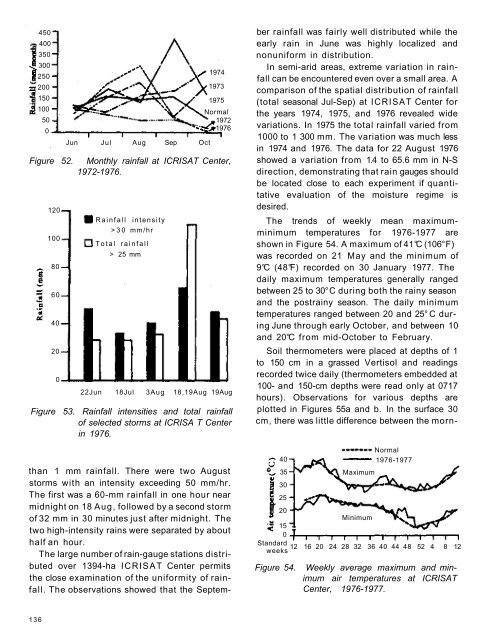
22Jun 18Jul 3Aug 18,19Aug 19Aug<br />
Figure 53. Rainfall intensities and total rainfall<br />
of selected storms at ICRISA T Center<br />
in 1976.<br />
than 1 mm rainfall. There were two August<br />
storms with an intensity exceeding 50 mm/hr.<br />
The first was a 60-mm rainfall in one hour near<br />
midnight on 18 Aug, followed by a second storm<br />
of 32 mm in 30 minutes just after midnight. The<br />
two high-intensity rains were separated by about<br />
half an hour.<br />
The large number of rain-gauge stations distributed<br />
over 1394-ha ICRISAT Center permits<br />
the close examination of the uniformity of rainfall.<br />
The observations showed that the September<br />
rainfall was fairly well distributed while the<br />
early rain in June was highly localized and<br />
nonuniform in distribution.<br />
In semi-arid areas, extreme variation in rainfall<br />
can be encountered even over a small area. A<br />
comparison of the spatial distribution of rainfall<br />
(total seasonal Jul-Sep) at ICRISAT Center for<br />
the years 1974, 1975, and 1976 revealed wide<br />
variations. In 1975 the total rainfall varied from<br />
1000 to 1 300 mm. The variation was much less<br />
in 1974 and 1976. The data for 22 August 1976<br />
showed a variation from 1.4 to 65.6 mm in N-S<br />
direction, demonstrating that rain gauges should<br />
be located close to each experiment if quantitative<br />
evaluation of the moisture regime is<br />
desired.<br />
The trends of weekly mean maximumminimum<br />
temperatures for 1976-1977 are<br />
shown in Figure 54. A maximum of 41°C (106° F)<br />
was recorded on 21 May and the minimum of<br />
9°C (48°F) recorded on 30 January 1977. The<br />
daily maximum temperatures generally ranged<br />
between 25 to 30° C during both the rainy season<br />
and the postrainy season. The daily minimum<br />
temperatures ranged between 20 and 25° C during<br />
June through early October, and between 10<br />
and 20°C from mid-October to February.<br />
Soil thermometers were placed at depths of 1<br />
to 150 cm in a grassed Vertisol and readings<br />
recorded twice daily (thermometers embedded at<br />
100- and 150-cm depths were read only at 0717<br />
hours). Observations for various depths are<br />
plotted in Figures 55a and b. In the surface 30<br />
cm, there was little difference between the morn-<br />
40<br />
35<br />
30<br />
25<br />
20<br />
Minimum<br />
15<br />
0<br />
Standard<br />
12 16 20 24 28 32 36 40 44 48 52 4 8 12<br />
weeks<br />
Figure 54.<br />
Maximum<br />
Normal<br />
1976-1977<br />
Weekly average maximum and minimum<br />
air temperatures at ICRISAT<br />
Center, 1976-1977.<br />
136