
You also want an ePaper? Increase the reach of your titles
YUMPU automatically turns print PDFs into web optimized ePapers that Google loves.
30<br />
25<br />
20<br />
15<br />
10<br />
60<br />
50<br />
40<br />
30<br />
a .<br />
0 7 1 7 h o u r s<br />
30-cm<br />
depth<br />
150-cm depth<br />
15-cm depth<br />
20<br />
Standard 12 16 20 24 28 32 36 40 44 48 52 4<br />
weeks<br />
8 12<br />
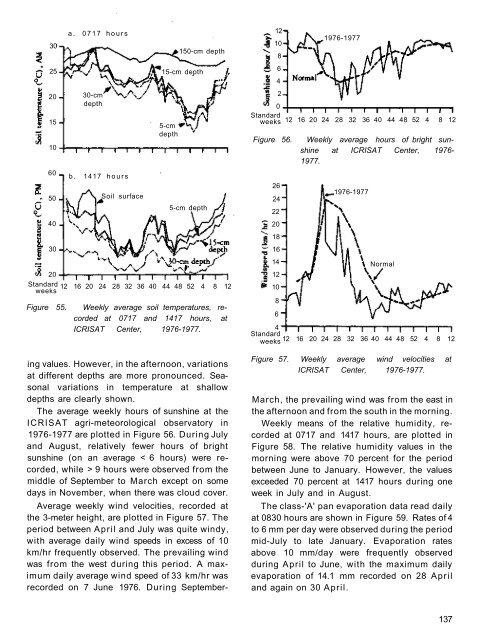
Figure 55.<br />
b .<br />
1417 h o u r s<br />
Soil surface<br />
5-cm<br />
depth<br />
5-cm depth<br />
Weekly average soil temperatures, recorded<br />
at 0717 and 1417 hours, at<br />
ICRISAT Center, 1976-1977.<br />
ing values. However, in the afternoon, variations<br />
at different depths are more pronounced. Seasonal<br />
variations in temperature at shallow<br />
depths are clearly shown.<br />
The average weekly hours of sunshine at the<br />
ICRISAT agri-meteorological observatory in<br />
1976-1977 are plotted in Figure 56. During July<br />
and August, relatively fewer hours of bright<br />
sunshine (on an average < 6 hours) were recorded,<br />
while > 9 hours were observed from the<br />
middle of September to March except on some<br />
days in November, when there was cloud cover.<br />
Average weekly wind velocities, recorded at<br />
the 3-meter height, are plotted in Figure 57. The<br />
period between April and July was quite windy,<br />
with average daily wind speeds in excess of 10<br />
km/hr frequently observed. The prevailing wind<br />
was from the west during this period. A maximum<br />
daily average wind speed of 33 km/hr was<br />
recorded on 7 June 1976. During September-<br />
12<br />
10<br />
8<br />
6<br />
4<br />
2<br />
1976-1977<br />
0<br />
Standard<br />
weeks 12 16 20 24 28 32 36 40 44 48 52 4 8 12<br />
Figure 56.<br />
26<br />
24<br />
22<br />
20<br />
18<br />
16<br />
14<br />
12<br />
10<br />
8<br />
6<br />
Weekly average hours of bright sunshine<br />
at ICRISAT Center, 1976-<br />
1977.<br />
1976-1977<br />
Normal<br />
4<br />
Standard<br />
weeks 12 16 20 24 28 32 36 40 44 48 52 4 8 12<br />
Figure 57. Weekly average wind velocities at<br />
ICRISAT Center, 1976-1977.<br />
March, the prevailing wind was from the east in<br />
the afternoon and from the south in the morning.<br />
Weekly means of the relative humidity, recorded<br />
at 0717 and 1417 hours, are plotted in<br />
Figure 58. The relative humidity values in the<br />
morning were above 70 percent for the period<br />
between June to January. However, the values<br />
exceeded 70 percent at 1417 hours during one<br />
week in July and in August.<br />
The class-'A' pan evaporation data read daily<br />
at 0830 hours are shown in Figure 59. Rates of 4<br />
to 6 mm per day were observed during the period<br />
mid-July to late January. Evaporation rates<br />
above 10 mm/day were frequently observed<br />
during April to June, with the maximum daily<br />
evaporation of 14.1 mm recorded on 28 April<br />
and again on 30 April.<br />
137