- Page 2:
ICRISAT ANNUAL REPORT 1976-1977 I n
- Page 5 and 6:
About This Report This is the fourt
- Page 7 and 8:
F a r m i n g s y s t e m s 129,133
- Page 9 and 10:
Dr. Djibril Sene (Member) Delegatio
- Page 11 and 12:
N. Seetharama, Ph.D., plant physiol
- Page 13 and 14:
Acronyms and selected abbreviations
- Page 16 and 17:
Director's Introduction The year de
- Page 18 and 19:
A high point of the ICRISAT year wa
- Page 20 and 21:
Research has reached the stage wher
- Page 22 and 23:
Work continued on the ICRISAT water
- Page 24:
ing Board has established a standin
- Page 27 and 28:
made by the ICRISAT programs in Afr
- Page 29 and 30:
The efficiency of small plots in sc
- Page 31 and 32:
shows great potential for reduced s
- Page 36 and 37:
T H E C E R E A L S Sorghum (Sorghu
- Page 40 and 41:
S o r g h u m Germplasm Collection
- Page 42:
Table 1 continued Institution Locat
- Page 45 and 46:
ny are being evaluated jointly with
- Page 47 and 48:
Table 5. Grain-yield dsta on some e
- Page 49 and 50:
Table 7. The relationship between c
- Page 51 and 52:
Table 8. Yield data of selected gra
- Page 53 and 54:
3000 2 500 2000 A. M i l d Stress r
- Page 55 and 56:
Products Institute, London. The maj
- Page 57 and 58:
focused on learning how to manage o
- Page 59 and 60:
acetylene-induced ethylene producti
- Page 64 and 65:
P e a r l M i l l e t Germplasm We
- Page 66 and 67:
Figure 15. Cluster bagging and self
- Page 68 and 69:
Figure 18. Multiplication plot of a
- Page 70 and 71:
taken on potential parents, is bein
- Page 72 and 73:
Six hybrids in P M H T 1 yielded on
- Page 74 and 75:
the south (at Bhavanisagar) and wor
- Page 76 and 77:
Figure 22. Transverse section of th
- Page 78 and 79:
Relationship Among Plant Type, Popu
- Page 80 and 81:
materials in a sick-plot (i.e. a fi
- Page 82 and 83:
Ergot Less progress has been made w
- Page 84 and 85:
Using a 3:1 ratio to convert ethyle
- Page 86:
Pathology. The large-scale field sc
- Page 89:
search for new strains and related
- Page 93 and 94:
Available data on germplasm accessi
- Page 95 and 96:
Table 26 continued Institution Loca
- Page 97 and 98:
tivars in experimental plots. Ident
- Page 99 and 100:
niques will be tested for reliabili
- Page 101 and 102:
Figure 29. Screening for salt toler
- Page 103 and 104:
Nitrogen fixation by the nodules is
- Page 105 and 106:
fungus remained restricted to the u
- Page 107 and 108:
Whole-seed Protein vs. Dhal Protein
- Page 109:
The scope and limitations of taking
- Page 113 and 114:
accessions planted remained free of
- Page 115 and 116:
were carried out, particularly in I
- Page 117 and 118:
Table 37. Yield of chickpea followi
- Page 119 and 120:
30 20 10 0 40 30 20 10 0 8 6 4 2 0
- Page 121 and 122:
weight and leaf area of the seedlin
- Page 123 and 124:
In an experiment to determine the e
- Page 125 and 126:
0.75 0.65 0.55 r =+ 0.802** = - 0 .
- Page 127 and 128:
Table 42. Test and breeding materia
- Page 132 and 133:
G r o u n d n u t The groundnut imp
- Page 134 and 135:
Figure 45. Field hybridization tech
- Page 136 and 137:
Table 45. Performance of cultivars
- Page 138 and 139:
leaf extract. The titers obtained w
- Page 140 and 141:
to be either Hoagland or Shrive and
- Page 142:
kernels. We also plan to examine th
- Page 148 and 149:
F a r m i n g S y s t e m s 1) To a
- Page 150 and 151:
120 112 6 0 93 50 4 0 30 2 0 10 0 J
- Page 152 and 153:
30 25 20 15 10 60 50 40 30 a . 0 7
- Page 154 and 155:
Table 47. Climatic characteristics
- Page 156 and 157:
years, rainfall has a tendency to c
- Page 158 and 159:
cm bed at 0.6 % slope) and BW4 C (r
- Page 160 and 161:
Table 48. Effect of row spacing and
- Page 162 and 163:
and graded to no symptom on the you
- Page 164 and 165:
possible. Excess tillage tends to a
- Page 166 and 167:
A study is being initiated to analy
- Page 168 and 169:
The effects of three contour bunds
- Page 170 and 171:
Table 51. Effect of land management
- Page 172 and 173:
Table 52. Effects of plant populati
- Page 174 and 175:
Table 54. Land Equivalent Ratio and
- Page 176 and 177:
163
- Page 178 and 179: Table 57. Larval parasitism on Heli
- Page 180 and 181: Table 58. Pod numbers produced per
- Page 182 and 183: Plants artificially lodged appeared
- Page 184 and 185: 3000 2000 1000 0 M F V,F,M V,F V V
- Page 186 and 187: which ratooning of pigeonpea has be
- Page 188 and 189: maize and sorghum as intercrops rec
- Page 190 and 191: with the traditional blade harrow o
- Page 192 and 193: farming system is examined on an op
- Page 194 and 195: wide range of agroclimatic and econ
- Page 196 and 197: 183
- Page 198 and 199: An experiment comparing broad beds
- Page 200 and 201: the evapotranspiration for sorghum
- Page 202 and 203: was no more than 50 percent of the
- Page 204 and 205: Table 71. Grain yields and rupee va
- Page 206 and 207: stands and growth. The average gros
- Page 208 and 209: Vertisol watersheds). Thus, to make
- Page 210: References Cocheme, J., and P. Fran
- Page 215 and 216: SHOLAPUR DISTRICT MAHARASHTRA PENIN
- Page 217 and 218: 100 90 80 Small farms Medium farms
- Page 219 and 220: 150 Intercultivation with bullocks
- Page 221 and 222: Credit and Risk Data from ICRISAT's
- Page 223 and 224: nearly suit the requirements of bor
- Page 225 and 226: 150 140 130 C h i c k p e a s 120 1
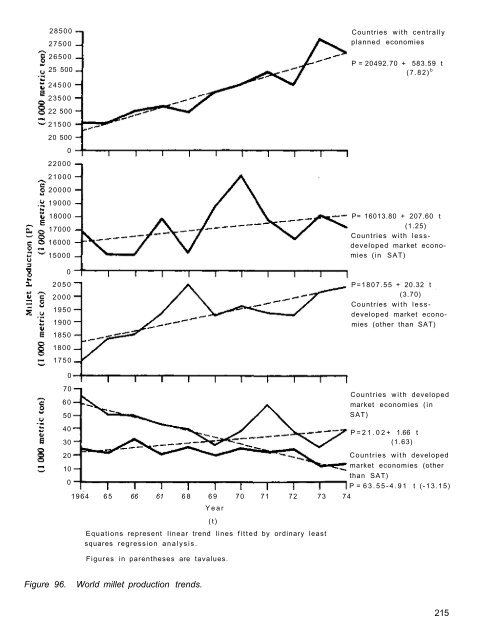
- Page 227: 28000 2 6 0 0 0 2 4 0 0 0 2 2 0 0 0
- Page 232 and 233: C o o p e r a t i v e P r o g r a m
- Page 234 and 235: utilizing six widely separated loca
- Page 236 and 237: familiar with the Institute's ongoi
- Page 238 and 239: Table 79. Persons completing long-t
- Page 240 and 241: Figure 99. ICRISAT's program for in
- Page 242 and 243: P l a n t Q u a r a n t i n e For t
- Page 244 and 245: Table 81 continued Sorghum Millet C
- Page 246 and 247: the University of Reading, U K , fo
- Page 248 and 249: C o m p u t e r S e r v i c e s ICR
- Page 250 and 251: L i b r a r y The Library was shift
- Page 252 and 253: Figure 101. The ICRISAT Library and