
Create successful ePaper yourself
Turn your PDF publications into a flip-book with our unique Google optimized e-Paper software.
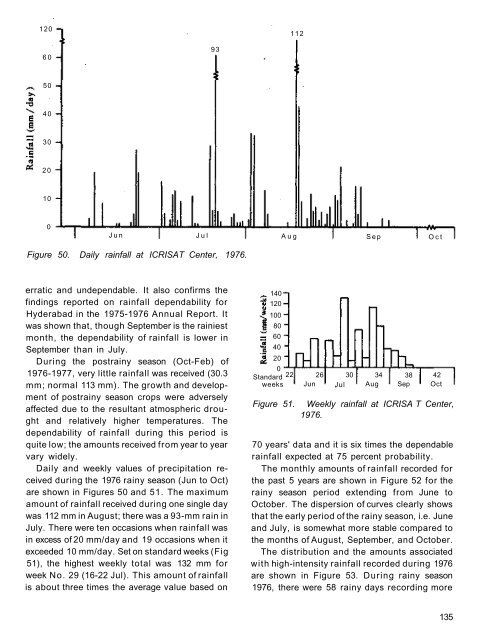
120<br />
112<br />
6 0<br />
93<br />
50<br />
4 0<br />
30<br />
2 0<br />
10<br />
0<br />
J u n J u l A u g S e p O c t<br />
Figure 50. Daily rainfall at ICRISAT Center, 1976.<br />
erratic and undependable. It also confirms the<br />
findings reported on rainfall dependability for<br />
Hyderabad in the 1975-1976 Annual Report. It<br />
was shown that, though September is the rainiest<br />
month, the dependability of rainfall is lower in<br />
September than in July.<br />
During the postrainy season (Oct-Feb) of<br />
1976-1977, very little rainfall was received (30.3<br />
mm; normal 113 mm). The growth and development<br />
of postrainy season crops were adversely<br />
affected due to the resultant atmospheric drought<br />
and relatively higher temperatures. The<br />
dependability of rainfall during this period is<br />
quite low; the amounts received from year to year<br />
vary widely.<br />
Daily and weekly values of precipitation received<br />
during the 1976 rainy season (Jun to Oct)<br />
are shown in Figures 50 and 51. The maximum<br />
amount of rainfall received during one single day<br />
was 112 mm in August; there was a 93-mm rain in<br />
July. There were ten occasions when rainfall was<br />
in excess of 20 mm/day and 19 occasions when it<br />
exceeded 10 mm/day. Set on standard weeks (Fig<br />
51), the highest weekly total was 132 mm for<br />
week No. 29 (16-22 Jul). This amount of rainfall<br />
is about three times the average value based on<br />
140<br />
120<br />
100<br />
80<br />
60<br />
40<br />
20<br />
0<br />
Standard 22 26<br />
weeks Jun<br />
Figure 51.<br />
30<br />
Jul<br />
34<br />
Aug<br />
38 42<br />
Sep Oct<br />
Weekly rainfall at ICRISA T Center,<br />
1976.<br />
70 years' data and it is six times the dependable<br />
rainfall expected at 75 percent probability.<br />
The monthly amounts of rainfall recorded for<br />
the past 5 years are shown in Figure 52 for the<br />
rainy season period extending from June to<br />
October. The dispersion of curves clearly shows<br />
that the early period of the rainy season, i.e. June<br />
and July, is somewhat more stable compared to<br />
the months of August, September, and October.<br />
The distribution and the amounts associated<br />
with high-intensity rainfall recorded during 1976<br />
are shown in Figure 53. During rainy season<br />
1976, there were 58 rainy days recording more<br />
135