
You also want an ePaper? Increase the reach of your titles
YUMPU automatically turns print PDFs into web optimized ePapers that Google loves.
Table 11. Comparison of MKJ (micro-Kjeldahl)<br />
and TAA (Technicon Auto Analyzer)<br />
values of protein in sorghum grain.<br />
Average protein<br />
Protein class Samples M K J T A A Error<br />
(%) (no) (%) (%) (%)<br />
7.0-7.9 6 7.65 7.55 - 1 . 3<br />
8.0-8.9 10 8.36 8.36 0.0<br />
9.0-9.9 9 9.53 9.49 - 0 . 4<br />
10.0-10.9 10 10.44 10.52 +0.8<br />
1050<br />
900<br />
750<br />
600<br />
450<br />
300<br />
Total number of<br />
samples: 6 758<br />
Range 1.84 - 5.57<br />
Mean: 3.01<br />
11.0-11.9 7 11.56 11.59 +0.3<br />
12.0-12.9 10 12.35 12.41 + 0.5<br />
13.0-13.9 11 13.31 13.34 + 0.2<br />
14.0-14.9 13 14.44 14.49 +0.4<br />
15.0-15.9 7 15.36 15.59 + 1.5<br />
16.0-16.9 10 16.44 16.38 - 0 . 4<br />
17.0-17.9 4 17.28 17.20 - 0 . 5<br />
18.0-18.9 2 18.05 18.35 + 1.7<br />
19.0-19.5 2 19.05 19.15 +0.5<br />
150<br />
2.0 2.4 2.8 3.2 3.6 4.0 4.4 4.8<br />
U I R / P Ratio<br />
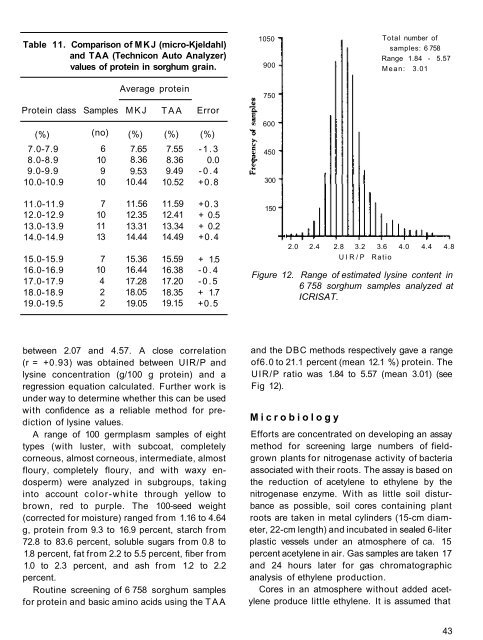
Figure 12. Range of estimated lysine content in<br />
6 758 sorghum samples analyzed at<br />
ICRISAT.<br />
between 2.07 and 4.57. A close correlation<br />
(r = +0.93) was obtained between UIR/P and<br />
lysine concentration (g/100 g protein) and a<br />
regression equation calculated. Further work is<br />
under way to determine whether this can be used<br />
with confidence as a reliable method for prediction<br />
of lysine values.<br />
A range of 100 germplasm samples of eight<br />
types (with luster, with subcoat, completely<br />
corneous, almost corneous, intermediate, almost<br />
floury, completely floury, and with waxy endosperm)<br />
were analyzed in subgroups, taking<br />
into account color-white through yellow to<br />
brown, red to purple. The 100-seed weight<br />
(corrected for moisture) ranged from 1.16 to 4.64<br />
g, protein from 9.3 to 16.9 percent, starch from<br />
72.8 to 83.6 percent, soluble sugars from 0.8 to<br />
1.8 percent, fat from 2.2 to 5.5 percent, fiber from<br />
1.0 to 2.3 percent, and ash from 1.2 to 2.2<br />
percent.<br />
Routine screening of 6 758 sorghum samples<br />
for protein and basic amino acids using the T A A<br />
and the DBC methods respectively gave a range<br />
of6.0 to 21.1 percent (mean 12.1 %) protein. The<br />
UIR/P ratio was 1.84 to 5.57 (mean 3.01) (see<br />
Fig 12).<br />
M i c r o b i o l o g y<br />
Efforts are concentrated on developing an assay<br />
method for screening large numbers of fieldgrown<br />
plants for nitrogenase activity of bacteria<br />
associated with their roots. The assay is based on<br />
the reduction of acetylene to ethylene by the<br />
nitrogenase enzyme. With as little soil disturbance<br />
as possible, soil cores containing plant<br />
roots are taken in metal cylinders (15-cm diameter,<br />
22-cm length) and incubated in sealed 6-liter<br />
plastic vessels under an atmosphere of ca. 15<br />
percent acetylene in air. Gas samples are taken 17<br />
and 24 hours later for gas chromatographic<br />
analysis of ethylene production.<br />
Cores in an atmosphere without added acetylene<br />
produce little ethylene. It is assumed that<br />
43