
You also want an ePaper? Increase the reach of your titles
YUMPU automatically turns print PDFs into web optimized ePapers that Google loves.
incomes of the least-affluent groups, who spend a<br />
large amount of their incomes on food grains.<br />
Increased real income will enable them to purchase<br />
additional food grains and hence improve<br />
their nutrition. If yield potentials of cereals,<br />
pulses, oilseeds, and other crops could all be<br />
substantially increased, nutritional improvements<br />
will follow as these all have complementary<br />
nutritional compositions. It is not necessary<br />
that any one of the grains have a "balanced<br />
content" of all nutrients — which is the underlying<br />
premise of cryptic quality breeding programs.<br />
People eat more than one food item each<br />
day. Making available additional quantities<br />
of all foods is the appropriate nutritional<br />
strategy. Nutrition education can help<br />
ensure that the correct mix is consumed. It is<br />
unreasonable to expect any one grain to provide<br />
a balanced diet.<br />
M a r k e t i n g Economics<br />
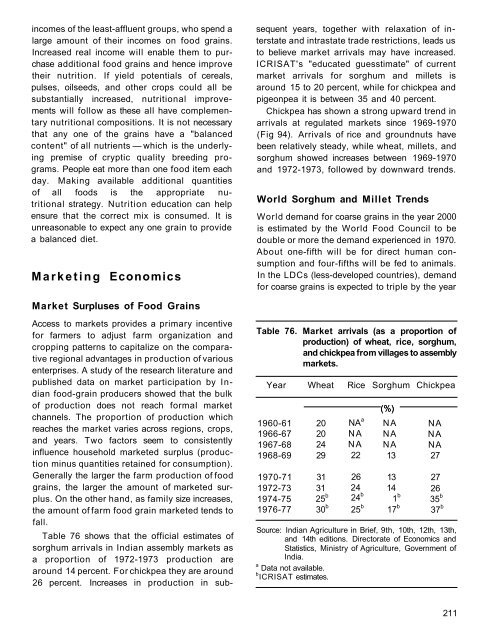
Table 76 shows that the official estimates of<br />
sorghum arrivals in Indian assembly markets as<br />
a proportion of 1972-1973 production are<br />
around 14 percent. For chickpea they are around<br />
26 percent. Increases in production in subsequent<br />
years, together with relaxation of interstate<br />
and intrastate trade restrictions, leads us<br />
to believe market arrivals may have increased.<br />
ICRISAT's "educated guesstimate" of current<br />
market arrivals for sorghum and millets is<br />
around 15 to 20 percent, while for chickpea and<br />
pigeonpea it is between 35 and 40 percent.<br />
Chickpea has shown a strong upward trend in<br />
arrivals at regulated markets since 1969-1970<br />
(Fig 94). Arrivals of rice and groundnuts have<br />
been relatively steady, while wheat, millets, and<br />
sorghum showed increases between 1969-1970<br />
and 1972-1973, followed by downward trends.<br />
World Sorghum and Millet Trends<br />
World demand for coarse grains in the year 2000<br />
is estimated by the World Food Council to be<br />
double or more the demand experienced in 1970.<br />
About one-fifth will be for direct human consumption<br />
and four-fifths will be fed to animals.<br />
In the LDCs (less-developed countries), demand<br />
for coarse grains is expected to triple by the year<br />
Market Surpluses of Food Grains<br />
Access to markets provides a primary incentive<br />
for farmers to adjust farm organization and<br />
cropping patterns to capitalize on the comparative<br />
regional advantages in production of various<br />
enterprises. A study of the research literature and<br />
published data on market participation by Indian<br />
food-grain producers showed that the bulk<br />
of production does not reach formal market<br />
channels. The proportion of production which<br />
reaches the market varies across regions, crops,<br />
and years. Two factors seem to consistently<br />
influence household marketed surplus (production<br />
minus quantities retained for consumption).<br />
Generally the larger the farm production of food<br />
grains, the larger the amount of marketed surplus.<br />
On the other hand, as family size increases,<br />
the amount of farm food grain marketed tends to<br />
fall.<br />
Table 76. Market arrivals (as a proportion of<br />
production) of wheat, rice, sorghum,<br />
and chickpea from villages to assembly<br />
markets.<br />
Year Wheat Rice Sorghum Chickpea<br />
(%)<br />
1960-61 20 NA a NA NA<br />
1966-67<br />
1967-68<br />
20<br />
24<br />
NA<br />
N A<br />
NA<br />
NA<br />
NA<br />
NA<br />
1968-69 29 22 13 27<br />
1970-71 31 26 13 27<br />
1972-73 31 24 14 26<br />
1974-75 25 b 24 b 1 b 35 b<br />
1976-77 30 b 25 b 17 b 37 b<br />
Source: Indian Agriculture in Brief, 9th, 10th, 12th, 13th,<br />
and 14th editions. Directorate of Economics and<br />
Statistics, Ministry of Agriculture, Government of<br />
India.<br />
a Data not available.<br />
b ICRISAT estimates.<br />
211