
Create successful ePaper yourself
Turn your PDF publications into a flip-book with our unique Google optimized e-Paper software.
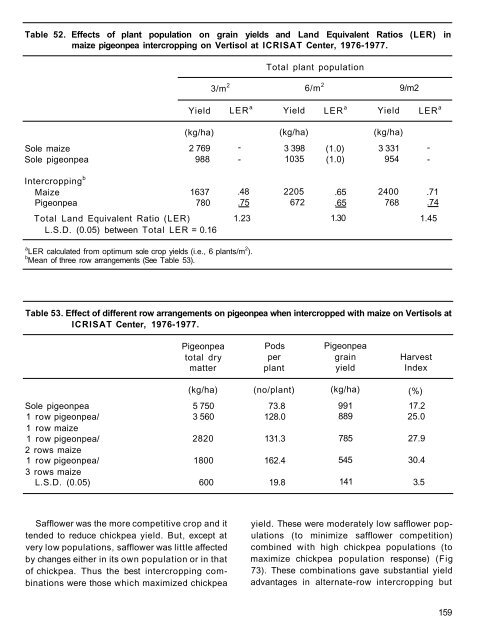
Table 52. Effects of plant population on grain yields and Land Equivalent Ratios (LER) in<br />
maize pigeonpea intercropping on Vertisol at ICRISAT Center, 1976-1977.<br />
Total plant population<br />
3/m 2 6/m 2 9/m2<br />
Yield LER a Yield LER a Yield LER a<br />
(kg/ha) (kg/ha) (kg/ha)<br />
Sole maize 2 769 - 3 398 (1.0) 3 331 -<br />
Sole pigeonpea 988 - 1035 (1.0) 954 -<br />
Intercropping b<br />
Maize 1637 .48 2205 .65 2400 .71<br />
Pigeonpea 780 .75 672 .65 768 .74<br />
Total Land Equivalent Ratio (LER)<br />
L.S.D. (0.05) between Total LER = 0.16<br />
1.23<br />
a LER calculated from optimum sole crop yields (i.e., 6 plants/m 2 ).<br />
b Mean of three row arrangements (See Table 53).<br />
1.30<br />
1.45<br />
Table 53. Effect of different row arrangements on pigeonpea when intercropped with maize on Vertisols at<br />
ICRISAT Center, 1976-1977.<br />
Pigeonpea Pods Pigeonpea<br />
total dry per grain Harvest<br />
matter plant yield Index<br />
(kg/ha) (no/plant) (kg/ha) (%)<br />
Sole pigeonpea 5 750 73.8 991 17.2<br />
1 row pigeonpea/ 3 560 128.0 889 25.0<br />
1 row maize<br />
1 row pigeonpea/ 2820 131.3 785 27.9<br />
2 rows maize<br />
1 row pigeonpea/ 1800 162.4 545 30.4<br />
3 rows maize<br />
L.S.D. (0.05) 600 19.8 141 3.5<br />
Safflower was the more competitive crop and it<br />
tended to reduce chickpea yield. But, except at<br />
very low populations, safflower was little affected<br />
by changes either in its own population or in that<br />
of chickpea. Thus the best intercropping combinations<br />
were those which maximized chickpea<br />
yield. These were moderately low safflower populations<br />
(to minimize safflower competition)<br />
combined with high chickpea populations (to<br />
maximize chickpea population response) (Fig<br />
73). These combinations gave substantial yield<br />
advantages in alternate-row intercropping but<br />
159