Retinal Prosthesis Dissertation - Student Home Pages
Retinal Prosthesis Dissertation - Student Home Pages
Retinal Prosthesis Dissertation - Student Home Pages
You also want an ePaper? Increase the reach of your titles
YUMPU automatically turns print PDFs into web optimized ePapers that Google loves.
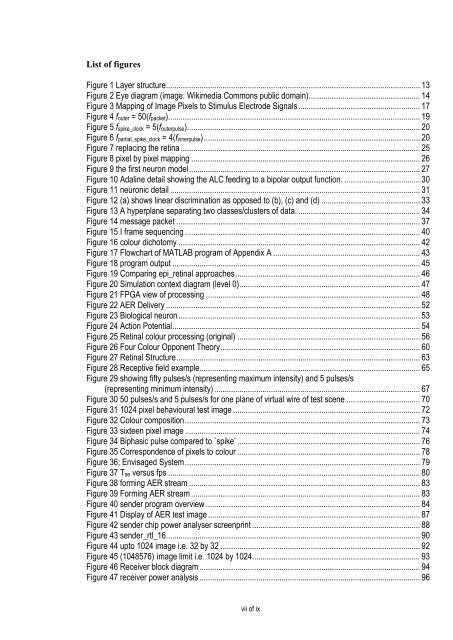
List of figures<br />
Figure 1 Layer structure ......................................................................................................................... 13<br />
Figure 2 Eye diagram (image: Wikimedia Commons public domain) ..................................................... 14<br />
Figure 3 Mapping of Image Pixels to Stimulus Electrode Signals .......................................................... 17<br />
Figure 4 fouter = 50(fpacket) ........................................................................................................................ 19<br />
Figure 5 fspike_clock = 5(fouterpulse) ............................................................................................................... 20<br />
Figure 6 fpartial_spike_clock = 4(finnerpulse) ....................................................................................................... 20<br />
Figure 7 replacing the retina .................................................................................................................. 25<br />
Figure 8 pixel by pixel mapping ............................................................................................................. 26<br />
Figure 9 the first neuron model .............................................................................................................. 27<br />
Figure 10 Adaline detail showing the ALC feeding to a bipolar output function. .................................... 30<br />
Figure 11 neuronic detail ....................................................................................................................... 31<br />
Figure 12 (a) shows linear discrimination as opposed to (b), (c) and (d) ............................................... 33<br />
Figure 13 A hyperplane separating two classes/clusters of data. .......................................................... 34<br />
Figure 14 message packet .................................................................................................................... 37<br />
Figure 15 I frame sequencing ................................................................................................................ 40<br />
Figure 16 colour dichotomy ................................................................................................................... 42<br />
Figure 17 Flowchart of MATLAB program of Appendix A ...................................................................... 43<br />
Figure 18 program output ...................................................................................................................... 45<br />
Figure 19 Comparing epi_retinal approaches ........................................................................................ 46<br />
Figure 20 Simulation context diagram (level 0) ...................................................................................... 47<br />
Figure 21 FPGA view of processing ...................................................................................................... 48<br />
Figure 22 AER Delivery ......................................................................................................................... 52<br />
Figure 23 Biological neuron ................................................................................................................... 53<br />
Figure 24 Action Potential ...................................................................................................................... 54<br />
Figure 25 <strong>Retinal</strong> colour processing (original) ....................................................................................... 56<br />
Figure 26 Four Colour Opponent Theory ............................................................................................... 60<br />
Figure 27 <strong>Retinal</strong> Structure .................................................................................................................... 63<br />
Figure 28 Receptive field example......................................................................................................... 65<br />
Figure 29 showing fifty pulses/s (representing maximum intensity) and 5 pulses/s<br />
(representing minimum intensity) .................................................................................................. 67<br />
Figure 30 50 pulses/s and 5 pulses/s for one plane of virtual wire of test scene ................................... 70<br />
Figure 31 1024 pixel behavioural test image ......................................................................................... 72<br />
Figure 32 Colour composition ................................................................................................................ 73<br />
Figure 33 sixteen pixel image ................................................................................................................ 74<br />
Figure 34 Biphasic pulse compared to `spike’ ....................................................................................... 76<br />
Figure 35 Correspondence of pixels to colour ....................................................................................... 78<br />
Figure 36; Envisaged System ................................................................................................................ 79<br />
Figure 37 Tae versus fps ........................................................................................................................ 80<br />
Figure 38 forming AER stream .............................................................................................................. 83<br />
Figure 39 Forming AER stream ............................................................................................................. 83<br />
Figure 40 sender program overview ...................................................................................................... 84<br />
Figure 41 Display of AER test image ..................................................................................................... 87<br />
Figure 42 sender chip power analyser screenprint ................................................................................ 88<br />
Figure 43 sender_rtl_16 ......................................................................................................................... 90<br />
Figure 44 upto 1024 image i.e. 32 by 32 ............................................................................................... 92<br />
Figure 45 (1048576) image limit i.e. 1024 by 1024................................................................................ 93<br />
Figure 46 Receiver block diagram ......................................................................................................... 94<br />
Figure 47 receiver power analysis ......................................................................................................... 96<br />
vii of ix


