

literacy for life; EFA global monitoring report, 2006 - Institut de ...
literacy for life; EFA global monitoring report, 2006 - Institut de ...
literacy for life; EFA global monitoring report, 2006 - Institut de ...

Create successful ePaper yourself
Turn your PDF publications into a flip-book with our unique Google optimized e-Paper software.
0<br />
2<br />
0<br />
6<br />
110 / CHAPTER 4<br />
Education <strong>for</strong> All Global Monitoring Report<br />
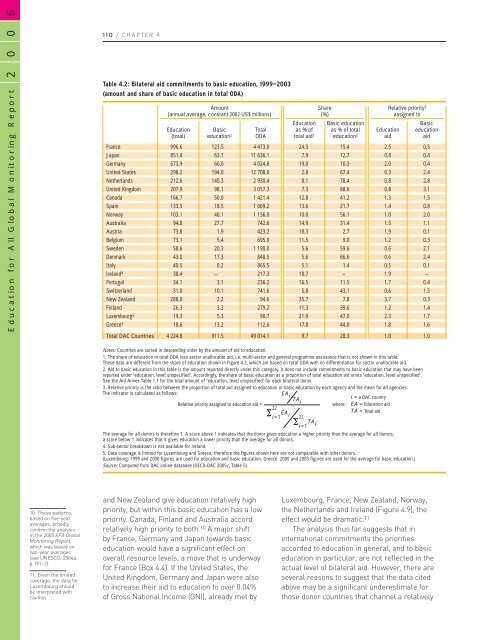
Table 4.2: Bilateral aid commitments to basic education, 1999—2003<br />
(amount and share of basic education in total ODA)<br />
France<br />
Japan<br />
Germany<br />
United States<br />
Netherlands<br />
United Kingdom<br />
Canada<br />
Spain<br />
Norway<br />
Australia<br />
Austria<br />
Belgium<br />
Swe<strong>de</strong>n<br />
Denmark<br />
Italy<br />
Ireland 4<br />
Portugal<br />
Switzerland<br />
New Zealand<br />
Finland<br />
Luxembourg 5<br />
Greece 5<br />
Total DAC Countries<br />
Amount<br />
(annual average, constant 2002 US$ millions)<br />
Education<br />
(total)<br />
Basic<br />
education 2<br />
Total<br />
ODA<br />
Education<br />
as % of<br />
total aid 1<br />
Share<br />
(%)<br />
Basic education<br />
as % of total<br />
education 2<br />
Education<br />
aid<br />
Relative priority 3<br />
assigned to<br />
Basic<br />
education<br />
aid<br />
996.6 123.5 4 473.0 24.3 15.4 2.5 0.5<br />
851.4 63.1 11 636.1 7.9 12.7 0.8 0.4<br />
673.9 66.0 4 024.8 19.0 10.3 2.0 0.4<br />
298.2 194.0 12 708.0 2.8 67.4 0.3 2.4<br />
212.6 140.3 2 930.4 8.1 78.4 0.8 2.8<br />
207.9 98.1 3 057.3 7.3 88.6 0.8 3.1<br />
166.7 50.0 1 421.4 12.8 41.2 1.3 1.5<br />
133.5 18.5 1 069.2 13.6 21.7 1.4 0.8<br />
103.1 48.1 1 156.0 10.0 56.1 1.0 2.0<br />
94.8 27.7 742.6 14.9 31.4 1.5 1.1<br />
73.8 1.9 423.2 18.3 2.7 1.9 0.1<br />
73.1 5.4 695.9 11.5 9.0 1.2 0.3<br />
58.6 20.3 1 190.0 5.6 59.6 0.6 2.1<br />
43.0 17.3 848.5 5.6 66.6 0.6 2.4<br />
40.5 0.2 865.5 5.1 1.4 0.5 0.1<br />
38.4 … 217.3 18.7 – 1.9 –<br />
34.1 3.1 236.2 16.5 11.5 1.7 0.4<br />
31.0 10.1 741.6 5.8 43.1 0.6 1.5<br />
288.0 2.2 94.6 35.7 7.8 3.7 0.3<br />
26.3 3.2 279.2 11.3 39.6 1.2 1.4<br />
19.3 5.3 90.7 21.9 47.0 2.3 1.7<br />
18.6 13.2 112.6 17.8 44.0 1.8 1.6<br />
4 224.8 911.5 49 014.1 9.7 28.3 1.0 1.0<br />
Notes: Countries are sorted in <strong>de</strong>scending or<strong>de</strong>r by the amount of aid to education.<br />
1. The share of education in total ODA less sector unallocable aid, i.e. multi-sector and general programme assistance that is not shown in this table.<br />
These data are different from the share of education shown in Figure 4.3, which are based on total ODA with no differentiation <strong>for</strong> sector unallocable aid.<br />
2. Aid to basic education in this table is the amount <strong>report</strong>ed directly un<strong>de</strong>r this category. It does not inclu<strong>de</strong> commitments to basic education that may have been<br />
<strong>report</strong>ed un<strong>de</strong>r ‘education, level unspecified’. Accordingly, the share of basic education as a proportion of total education aid omits ‘education, level unspecified’.<br />
See the Aid Annex Table 1.1 <strong>for</strong> the total amount of ‘education, level unspecified’ <strong>for</strong> each bilateral donor.<br />
3. Relative priority is the ratio between the proportion of total aid assigned to education or basic education by each agency and the mean <strong>for</strong> all agencies.<br />
The indicator is calculated as follows:<br />
Relative priority assigned to education aid =<br />
∑ 22<br />
EA i=1 i<br />
EA i TAi<br />
∑ 22<br />
TA i=1 i<br />
The average <strong>for</strong> all donors is there<strong>for</strong>e 1. A score above 1 indicates that the donor gives education a higher priority than the average <strong>for</strong> all donors;<br />
a score below 1 indicates that it gives education a lower priority than the average <strong>for</strong> all donors.<br />
4. Sub-sector breakdown is not available <strong>for</strong> Ireland.<br />
5. Data coverage is limited <strong>for</strong> Luxembourg and Greece; there<strong>for</strong>e the figures shown here are not comparable with other donors.<br />
(Luxembourg: 1999 and 2000 figures are used <strong>for</strong> education and basic education. Greece: 2000 and 2003 figures are used <strong>for</strong> the average <strong>for</strong> basic education.)<br />
Source: Computed from DAC online database (OECD-DAC 2005c, Table 5).<br />
where:<br />
i = a DAC country<br />
EA = Education aid<br />
TA = Total aid<br />
10. These patterns,<br />
based on five-year<br />
averages, broadly<br />
confirm the analysis<br />
in the 2005 <strong>EFA</strong> Global<br />
Monitoring Report,<br />
which was based on<br />
two-year averages<br />
(see UNESCO, 2004a,<br />
p.191–2).<br />
11. Given the limited<br />
coverage, the data <strong>for</strong><br />
Luxembourg should<br />
be interpreted with<br />
caution.<br />
and New Zealand give education relatively high<br />
priority, but within this basic education has a low<br />
priority. Canada, Finland and Australia accord<br />
relatively high priority to both. 10 A major shift<br />
by France, Germany and Japan towards basic<br />
education would have a significant effect on<br />
overall resource levels, a move that is un<strong>de</strong>rway<br />
<strong>for</strong> France (Box 4.4). If the United States, the<br />
United Kingdom, Germany and Japan were also<br />
to increase their aid to education to over 0.04%<br />
of Gross National Income (GNI), already met by<br />
Luxembourg, France, New Zealand, Norway,<br />
the Netherlands and Ireland (Figure 4.9), the<br />
effect would be dramatic. 11<br />
The analysis thus far suggests that in<br />
international commitments the priorities<br />
accor<strong>de</strong>d to education in general, and to basic<br />
education in particular, are not reflected in the<br />
actual level of bilateral aid. However, there are<br />
several reasons to suggest that the data cited<br />
above may be a significant un<strong>de</strong>restimate <strong>for</strong><br />
those donor countries that channel a relatively


