

literacy for life; EFA global monitoring report, 2006 - Institut de ...
literacy for life; EFA global monitoring report, 2006 - Institut de ...
literacy for life; EFA global monitoring report, 2006 - Institut de ...

Create successful ePaper yourself
Turn your PDF publications into a flip-book with our unique Google optimized e-Paper software.
0<br />
0<br />
6<br />
50 / CHAPTER 2<br />
2<br />
Education <strong>for</strong> All Global Monitoring Report<br />
Once enrolled,<br />
girls tend to<br />
per<strong>for</strong>m better<br />
than boys<br />
Progress is being ma<strong>de</strong> regarding gen<strong>de</strong>r<br />
parity in enrolment, as 104 countries out of the 180<br />
<strong>for</strong> which 2002 data are available have achieved<br />
parity in primary education as measured by the<br />
GPI of gross enrolment ratios (see statistical<br />
annex, Table 5). Major gen<strong>de</strong>r disparities that<br />
impe<strong>de</strong> girls are now concentrated in the Arab<br />
States, South and West Asia and sub-Saharan<br />
Africa, though the situation has improved<br />
consi<strong>de</strong>rably since 1998 (Table 2.5).<br />
Table 2.5: Gross enrolment ratios by gen<strong>de</strong>r in primary education, by region,<br />
1998 and 2002<br />
World<br />
Developing countries<br />
Developed countries<br />
Countries in transition<br />
Sub-Saharan Africa<br />
Arab States<br />
Central Asia<br />
East Asia and the Pacific<br />
South and West Asia<br />
Latin America and the Caribbean<br />
North America and Western Europe<br />
Central and Eastern Europe<br />
Source: Statistical annex, Table 5.<br />
Gross enrolment ratios<br />
1998 2002<br />
Male Female GPI Male Female<br />
% % (F/M) % %<br />
104.5 96.3<br />
104.9 95.5<br />
101.8 102.3<br />
101.1 99.9<br />
86.8 73.1<br />
95.7 83.5<br />
99.5 98.4<br />
112.1 111.0<br />
102.9 85.6<br />
122.9 119.9<br />
102.1 103.0<br />
99.3 95.3<br />
0.92<br />
0.91<br />
1.00<br />
0.99<br />
0.84<br />
0.87<br />
0.99<br />
0.99<br />
0.83<br />
0.98<br />
1.01<br />
0.96<br />
106.6 100.4<br />
107.3 100.3<br />
100.7 100.4<br />
106.0 105.1<br />
97.9 84.3<br />
98.6 88.8<br />
102.5 100.7<br />
111.7 110.2<br />
106.2 97.5<br />
120.8 118.0<br />
100.9 100.7<br />
100.8 98.1<br />
GPI<br />
(F/M)<br />
0.94<br />
0.93<br />
1.00<br />
0.99<br />
0.86<br />
0.90<br />
0.98<br />
0.99<br />
0.92<br />
0.98<br />
1.00<br />
0.97<br />
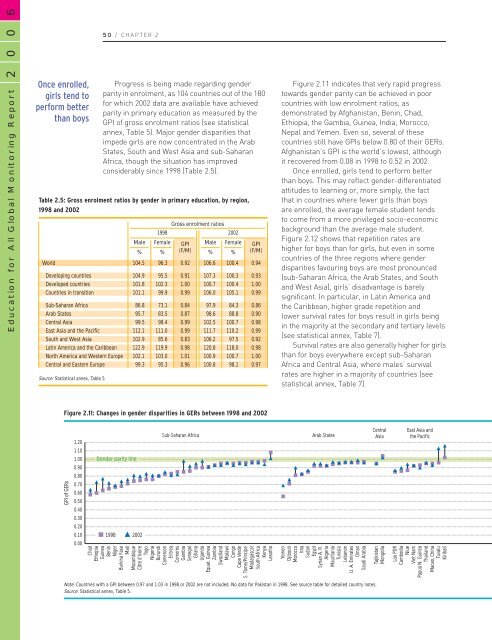
Figure 2.11 indicates that very rapid progress<br />
towards gen<strong>de</strong>r parity can be achieved in poor<br />
countries with low enrolment ratios, as<br />
<strong>de</strong>monstrated by Afghanistan, Benin, Chad,<br />
Ethiopia, the Gambia, Guinea, India, Morocco,<br />
Nepal and Yemen. Even so, several of these<br />
countries still have GPIs below 0.80 of their GERs.<br />
Afghanistan’s GPI is the world’s lowest, although<br />
it recovered from 0.08 in 1998 to 0.52 in 2002.<br />
Once enrolled, girls tend to per<strong>for</strong>m better<br />
than boys. This may reflect gen<strong>de</strong>r-differentiated<br />
attitu<strong>de</strong>s to learning or, more simply, the fact<br />
that in countries where fewer girls than boys<br />
are enrolled, the average female stu<strong>de</strong>nt tends<br />
to come from a more privileged socio-economic<br />
background than the average male stu<strong>de</strong>nt.<br />
Figure 2.12 shows that repetition rates are<br />
higher <strong>for</strong> boys than <strong>for</strong> girls, but even in some<br />
countries of the three regions where gen<strong>de</strong>r<br />
disparities favouring boys are most pronounced<br />
(sub-Saharan Africa, the Arab States, and South<br />
and West Asia), girls’ disadvantage is barely<br />
significant. In particular, in Latin America and<br />
the Caribbean, higher gra<strong>de</strong> repetition and<br />
lower survival rates <strong>for</strong> boys result in girls being<br />
in the majority at the secondary and tertiary levels<br />
(see statistical annex, Table 7).<br />
Survival rates are also generally higher <strong>for</strong> girls<br />
than <strong>for</strong> boys everywhere except sub-Saharan<br />
Africa and Central Asia, where males’ survival<br />
rates are higher in a majority of countries (see<br />
statistical annex, Table 7).<br />
Figure 2.11: Changes in gen<strong>de</strong>r disparities in GERs between 1998 and 2002<br />
GPI of GERs<br />
1.20<br />
1.10<br />
1.00<br />
0.90<br />
0.80<br />
0.70<br />
0.60<br />
0.50<br />
0.40<br />
0.30<br />
0.20<br />
0.10<br />
0.00<br />
Gen<strong>de</strong>r parity line<br />
1998 2002<br />
Sub-Saharan Africa<br />
Chad<br />
Ethiopia<br />
Guinea<br />
Benin<br />
Niger<br />
Burkina Faso<br />
Mali<br />
Mozambique<br />
Côte d’Ivoire<br />
Togo<br />
Nigeria<br />
Burundi<br />
Cameroon<br />
Eritrea<br />
Comoros<br />
Gambia<br />
Senegal<br />
Ghana<br />
Uganda<br />
Equat. Guinea<br />
Zambia<br />
Swaziland<br />
Malawi<br />
Congo<br />
Cape Ver<strong>de</strong><br />
S. Tome/Principe<br />
Madagascar<br />
South Africa<br />
Kenya<br />
Lesotho<br />
Arab States<br />
Yemen<br />
Djibouti<br />
Morocco<br />
Iraq<br />
Sudan<br />
Egypt<br />
Syrian A. R.<br />
Algeria<br />
Mauritania<br />
Tunisia<br />
Lebanon<br />
U. A. Emirates<br />
Oman<br />
Saudi Arabia<br />
Central<br />
Asia<br />
Tajikistan<br />
Mongolia<br />
East Asia and<br />
the Pacific<br />
Lao PDR<br />
Cambodia<br />
Niue<br />
Viet Nam<br />
Papua N. Guinea<br />
Thailand<br />
Macao, China<br />
Tuvalu<br />
Kiribati<br />
Note: Countries with a GPI between 0.97 and 1.03 in 1998 or 2002 are not inclu<strong>de</strong>d. No data <strong>for</strong> Pakistan in 1998. See source table <strong>for</strong> <strong>de</strong>tailed country notes.<br />
Source: Statistical annex, Table 5.


