

literacy for life; EFA global monitoring report, 2006 - Institut de ...
literacy for life; EFA global monitoring report, 2006 - Institut de ...
literacy for life; EFA global monitoring report, 2006 - Institut de ...

You also want an ePaper? Increase the reach of your titles
YUMPU automatically turns print PDFs into web optimized ePapers that Google loves.
0<br />
2<br />
0<br />
6<br />
114 / CHAPTER 4<br />
Education <strong>for</strong> All Global Monitoring Report<br />
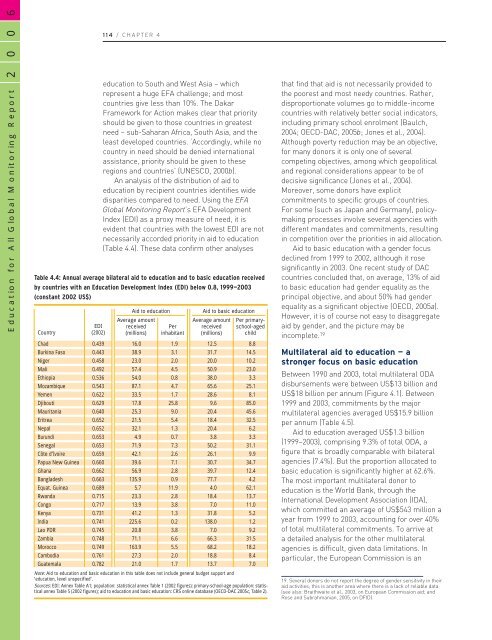
Table 4.4: Annual average bilateral aid to education and to basic education received<br />
by countries with an Education Development In<strong>de</strong>x (EDI) below 0.8, 1999—2003<br />
(constant 2002 US$)<br />
Country<br />
Chad<br />
Burkina Faso<br />
Niger<br />
Mali<br />
Ethiopia<br />
Mozambique<br />
Yemen<br />
Djibouti<br />
Mauritania<br />
Eritrea<br />
Nepal<br />
Burundi<br />
Senegal<br />
Côte d’Ivoire<br />
Papua New Guinea<br />
Ghana<br />
Bangla<strong>de</strong>sh<br />
Equat. Guinea<br />
Rwanda<br />
Congo<br />
Kenya<br />
India<br />
Lao PDR<br />
Zambia<br />
Morocco<br />
Cambodia<br />
Guatemala<br />
EDI<br />
(2002)<br />
education to South and West Asia – which<br />
represent a huge <strong>EFA</strong> challenge; and most<br />
countries give less than 10%. The Dakar<br />
Framework <strong>for</strong> Action makes clear that priority<br />
should be given to those countries in greatest<br />
need – sub-Saharan Africa, South Asia, and the<br />
least <strong>de</strong>veloped countries. ‘Accordingly, while no<br />
country in need should be <strong>de</strong>nied international<br />
assistance, priority should be given to these<br />
regions and countries’ (UNESCO, 2000b).<br />
An analysis of the distribution of aid to<br />
education by recipient countries i<strong>de</strong>ntifies wi<strong>de</strong><br />
disparities compared to need. Using the <strong>EFA</strong><br />
Global Monitoring Report’s <strong>EFA</strong> Development<br />
In<strong>de</strong>x (EDI) as a proxy measure of need, it is<br />
evi<strong>de</strong>nt that countries with the lowest EDI are not<br />
necessarily accor<strong>de</strong>d priority in aid to education<br />
(Table 4.4). These data confirm other analyses<br />
Aid to education<br />
Average amount<br />
received<br />
(millions)<br />
Per<br />
inhabitant<br />
Aid to basic education<br />
Average amount<br />
received<br />
(millions)<br />
Per primaryschool-aged<br />
child<br />
0.439 16.0 1.9 12.5 8.8<br />
0.443 38.9 3.1 31.7 14.5<br />
0.458 23.0 2.0 20.0 10.2<br />
0.492 57.4 4.5 50.9 23.0<br />
0.536 54.0 0.8 38.0 3.3<br />
0.543 87.1 4.7 65.6 25.1<br />
0.622 33.5 1.7 28.6 8.1<br />
0.629 17.8 25.8 9.6 85.0<br />
0.640 25.3 9.0 20.4 45.6<br />
0.652 21.5 5.4 18.4 32.5<br />
0.652 32.1 1.3 20.4 6.2<br />
0.653 4.9 0.7 3.8 3.3<br />
0.653 71.9 7.3 50.2 31.1<br />
0.659 42.1 2.6 26.1 9.9<br />
0.660 39.6 7.1 30.7 34.7<br />
0.662 56.9 2.8 39.7 12.4<br />
0.663 135.9 0.9 77.7 4.2<br />
0.689 5.7 11.9 4.0 62.1<br />
0.715 23.3 2.8 18.4 13.7<br />
0.717 13.9 3.8 7.0 11.0<br />
0.731 41.2 1.3 31.8 5.2<br />
0.741 225.6 0.2 138.0 1.2<br />
0.745 20.8 3.8 7.0 9.2<br />
0.748 71.1 6.6 66.3 31.5<br />
0.749 163.9 5.5 68.2 18.2<br />
0.761 27.3 2.0 18.8 8.4<br />
0.782 21.0 1.7 13.7 7.0<br />
Note: Aid to education and basic education in this table does not inclu<strong>de</strong> general budget support and<br />
‘education, level unspecified’.<br />
Sources: EDI: Annex Table A1; population: statistical annex Table 1 (2002 figures); primary-school-age population: statistical<br />
annex Table 5 (2002 figures); aid to education and basic education: CRS online database (OECD-DAC 2005c, Table 2).<br />
that find that aid is not necessarily provi<strong>de</strong>d to<br />
the poorest and most needy countries. Rather,<br />
disproportionate volumes go to middle-income<br />
countries with relatively better social indicators,<br />
including primary school enrolment (Baulch,<br />
2004; OECD-DAC, 2005b; Jones et al., 2004).<br />
Although poverty reduction may be an objective,<br />
<strong>for</strong> many donors it is only one of several<br />
competing objectives, among which geopolitical<br />
and regional consi<strong>de</strong>rations appear to be of<br />
<strong>de</strong>cisive significance (Jones et al., 2004).<br />
Moreover, some donors have explicit<br />
commitments to specific groups of countries.<br />
For some (such as Japan and Germany), policymaking<br />
processes involve several agencies with<br />
different mandates and commitments, resulting<br />
in competition over the priorities in aid allocation.<br />
Aid to basic education with a gen<strong>de</strong>r focus<br />
<strong>de</strong>clined from 1999 to 2002, although it rose<br />
significantly in 2003. One recent study of DAC<br />
countries conclu<strong>de</strong>d that, on average, 13% of aid<br />
to basic education had gen<strong>de</strong>r equality as the<br />
principal objective, and about 50% had gen<strong>de</strong>r<br />
equality as a significant objective (OECD, 2005a).<br />
However, it is of course not easy to disaggregate<br />
aid by gen<strong>de</strong>r, and the picture may be<br />
incomplete. 19<br />
Multilateral aid to education — a<br />
stronger focus on basic education<br />
Between 1990 and 2003, total multilateral ODA<br />
disbursements were between US$13 billion and<br />
US$18 billion per annum (Figure 4.1). Between<br />
1999 and 2003, commitments by the major<br />
multilateral agencies averaged US$15.9 billion<br />
per annum (Table 4.5).<br />
Aid to education averaged US$1.3 billion<br />
(1999–2003), comprising 9.3% of total ODA, a<br />
figure that is broadly comparable with bilateral<br />
agencies (7.4%). But the proportion allocated to<br />
basic education is significantly higher at 62.6%.<br />
The most important multilateral donor to<br />
education is the World Bank, through the<br />
International Development Association (IDA),<br />
which committed an average of US$543 million a<br />
year from 1999 to 2003, accounting <strong>for</strong> over 40%<br />
of total multilateral commitments. To arrive at<br />
a <strong>de</strong>tailed analysis <strong>for</strong> the other multilateral<br />
agencies is difficult, given data limitations. In<br />
particular, the European Commission is an<br />
19. Several donors do not <strong>report</strong> the <strong>de</strong>gree of gen<strong>de</strong>r sensitivity in their<br />
aid activities; this is another area where there is a lack of reliable data<br />
(see also: Braithwaite et al., 2003, on European Commission aid; and<br />
Rose and Subrahmanian, 2005, on DFID).


