- Page 1 and 2:
EFA Global Monitoring Report 2 0 0
- Page 3 and 4:
Education for All UNESCO Publishing
- Page 5 and 6:
Foreword This fourth annual Educati
- Page 7 and 8:
Acknowledgements Former Director Ch
- Page 9 and 10:
Contents Headline messages . . . .
- Page 11 and 12:
List of figures, tables and text bo
- Page 13 and 14:
Tables 2.1: School life expectancy
- Page 15 and 16:
4.9: Working together for better-qu
- Page 17 and 18:
Literacy Literacy is: A right still
- Page 19 and 20:
Education for All Global Monitoring
- Page 21 and 22:
EXECUTIVE SUMMARY / 21 25-35% of al
- Page 23 and 24:
EXECUTIVE SUMMARY / 23 meeting the
- Page 25 and 26:
EXECUTIVE SUMMARY / 25 builds on le
- Page 27 and 28:
Education for All Global Monitoring
- Page 29 and 30:
LITERACY: THE CORE OF EDUCATION FOR
- Page 31 and 32:
LITERACY: THE CORE OF EDUCATION FOR
- Page 33 and 34:
LITERACY: THE CORE OF EDUCATION FOR
- Page 35 and 36:
argues that there is value in under
- Page 37 and 38:
Education for All Global Monitoring
- Page 39 and 40:
EFA PROGRESS: WHERE DO WE STAND? /
- Page 41 and 42:
EFA PROGRESS: WHERE DO WE STAND? /
- Page 43 and 44:
EFA PROGRESS: WHERE DO WE STAND? /
- Page 45 and 46:
EFA PROGRESS: WHERE DO WE STAND? /
- Page 47 and 48:
EFA PROGRESS: WHERE DO WE STAND? /
- Page 49 and 50:
EFA PROGRESS: WHERE DO WE STAND? /
- Page 51 and 52:
EFA PROGRESS: WHERE DO WE STAND? /
- Page 53 and 54:
EFA PROGRESS: WHERE DO WE STAND? /
- Page 55 and 56:
EFA PROGRESS: WHERE DO WE STAND? /
- Page 57 and 58:
EFA PROGRESS: WHERE DO WE STAND? /
- Page 59 and 60:
EFA PROGRESS: WHERE DO WE STAND? /
- Page 61 and 62:
EFA PROGRESS: WHERE DO WE STAND? /
- Page 63 and 64:
EFA PROGRESS: WHERE DO WE STAND? /
- Page 65 and 66:
EFA PROGRESS: WHERE DO WE STAND? /
- Page 67 and 68:
EFA PROGRESS: WHERE DO WE STAND? /
- Page 69 and 70:
EFA PROGRESS: WHERE DO WE STAND? /
- Page 71 and 72:
EFA PROGRESS: WHERE DO WE STAND? /
- Page 73 and 74:
a continued heavy focus on sub-Saha
- Page 75 and 76:
Education for All Global Monitoring
- Page 77 and 78:
COUNTRY EFFORTS: INCREASING MOMENTU
- Page 79 and 80:
COUNTRY EFFORTS: INCREASING MOMENTU
- Page 81 and 82:
COUNTRY EFFORTS: INCREASING MOMENTU
- Page 83 and 84:
COUNTRY EFFORTS: INCREASING MOMENTU
- Page 85 and 86:
COUNTRY EFFORTS: INCREASING MOMENTU
- Page 87 and 88:
COUNTRY EFFORTS: INCREASING MOMENTU
- Page 89 and 90:
COUNTRY EFFORTS: INCREASING MOMENTU
- Page 91 and 92:
COUNTRY EFFORTS: INCREASING MOMENTU
- Page 93 and 94:
COUNTRY EFFORTS: INCREASING MOMENTU
- Page 95 and 96:
COUNTRY EFFORTS: INCREASING MOMENTU
- Page 97 and 98:
COUNTRY EFFORTS: INCREASING MOMENTU
- Page 99 and 100:
COUNTRY EFFORTS: INCREASING MOMENTU
- Page 101 and 102:
COUNTRY EFFORTS: INCREASING MOMENTU
- Page 103 and 104:
COUNTRY EFFORTS: INCREASING MOMENTU
- Page 105 and 106:
Education for All Global Monitoring
- Page 107 and 108:
INTERNATIONAL COMMITMENTS: TIME TO
- Page 109 and 110:
INTERNATIONAL COMMITMENTS: TIME TO
- Page 111 and 112:
INTERNATIONAL COMMITMENTS: TIME TO
- Page 113 and 114:
INTERNATIONAL COMMITMENTS: TIME TO
- Page 115 and 116:
INTERNATIONAL COMMITMENTS: TIME TO
- Page 117 and 118: INTERNATIONAL COMMITMENTS: TIME TO
- Page 119 and 120: INTERNATIONAL COMMITMENTS: TIME TO
- Page 121 and 122: INTERNATIONAL COMMITMENTS: TIME TO
- Page 123 and 124: INTERNATIONAL COMMITMENTS: TIME TO
- Page 125 and 126: INTERNATIONAL COMMITMENTS: TIME TO
- Page 127 and 128: INTERNATIONAL COMMITMENTS: TIME TO
- Page 129 and 130: INTERNATIONAL COMMITMENTS: TIME TO
- Page 131 and 132: INTERNATIONAL COMMITMENTS: TIME TO
- Page 133 and 134: INTERNATIONAL COMMITMENTS: TIME TO
- Page 135 and 136: Education for All Global Monitoring
- Page 137 and 138: WHY LITERACY MATTERS / 137 provided
- Page 139 and 140: WHY LITERACY MATTERS / 139 limit si
- Page 141 and 142: WHY LITERACY MATTERS / 141 In Nepal
- Page 143 and 144: WHY LITERACY MATTERS / 143 provided
- Page 145 and 146: WHY LITERACY MATTERS / 145 the exis
- Page 147 and 148: Education for All Global Monitoring
- Page 149 and 150: UNDERSTANDINGS OF LITERACY / 149 Li
- Page 151 and 152: UNDERSTANDINGS OF LITERACY / 151 wo
- Page 153 and 154: UNDERSTANDINGS OF LITERACY / 153 Un
- Page 155 and 156: UNDERSTANDINGS OF LITERACY / 155 un
- Page 157 and 158: UNDERSTANDINGS OF LITERACY / 157 Ta
- Page 159 and 160: UNDERSTANDINGS OF LITERACY / 159 A
- Page 161 and 162: Education for All Global Monitoring
- Page 163 and 164: MAPPING THE GLOBAL LITERACY CHALLEN
- Page 165 and 166: MAPPING THE GLOBAL LITERACY CHALLEN
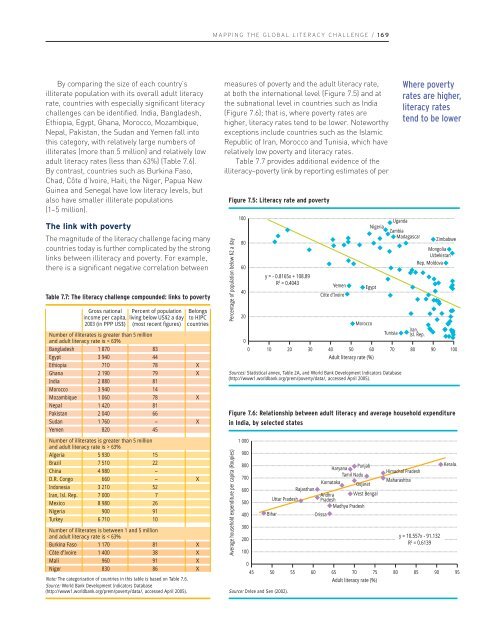
- Page 167: MAPPING THE GLOBAL LITERACY CHALLEN
- Page 171 and 172: MAPPING THE GLOBAL LITERACY CHALLEN
- Page 173 and 174: MAPPING THE GLOBAL LITERACY CHALLEN
- Page 175 and 176: MAPPING THE GLOBAL LITERACY CHALLEN
- Page 177 and 178: MAPPING THE GLOBAL LITERACY CHALLEN
- Page 179 and 180: MAPPING THE GLOBAL LITERACY CHALLEN
- Page 181 and 182: MAPPING THE GLOBAL LITERACY CHALLEN
- Page 183 and 184: MAPPING THE GLOBAL LITERACY CHALLEN
- Page 185 and 186: MAPPING THE GLOBAL LITERACY CHALLEN
- Page 187 and 188: MAPPING THE GLOBAL LITERACY CHALLEN
- Page 189 and 190: Education for All Global Monitoring
- Page 191 and 192: THE MAKING OF LITERATE SOCIETIES /
- Page 193 and 194: THE MAKING OF LITERATE SOCIETIES /
- Page 195 and 196: THE MAKING OF LITERATE SOCIETIES /
- Page 197 and 198: THE MAKING OF LITERATE SOCIETIES /
- Page 199 and 200: THE MAKING OF LITERATE SOCIETIES /
- Page 201 and 202: THE MAKING OF LITERATE SOCIETIES /
- Page 203 and 204: THE MAKING OF LITERATE SOCIETIES /
- Page 205 and 206: THE MAKING OF LITERATE SOCIETIES /
- Page 207 and 208: THE MAKING OF LITERATE SOCIETIES /
- Page 209 and 210: THE MAKING OF LITERATE SOCIETIES /
- Page 211 and 212: THE MAKING OF LITERATE SOCIETIES /
- Page 213 and 214: Language issues, literacy practices
- Page 215 and 216: Education for All Global Monitoring
- Page 217 and 218: GOOD POLICY, GOOD PRACTICE / 217 ot
- Page 219 and 220:
GOOD POLICY, GOOD PRACTICE / 219 pa
- Page 221 and 222:
GOOD POLICY, GOOD PRACTICE / 221 th
- Page 223 and 224:
GOOD POLICY, GOOD PRACTICE / 223 co
- Page 225 and 226:
GOOD POLICY, GOOD PRACTICE / 225 Bo
- Page 227 and 228:
GOOD POLICY, GOOD PRACTICE / 227 co
- Page 229 and 230:
GOOD POLICY, GOOD PRACTICE / 229 Me
- Page 231 and 232:
GOOD POLICY, GOOD PRACTICE / 231 sy
- Page 233 and 234:
GOOD POLICY, GOOD PRACTICE / 233 Th
- Page 235 and 236:
GOOD POLICY, GOOD PRACTICE / 235 fr
- Page 237 and 238:
GOOD POLICY, GOOD PRACTICE / 237 Ta
- Page 239 and 240:
GOOD POLICY, GOOD PRACTICE / 239 Bo
- Page 241 and 242:
GOOD POLICY, GOOD PRACTICE / 241 re
- Page 243 and 244:
GOOD POLICY, GOOD PRACTICE / 243 Ta
- Page 245 and 246:
GOOD POLICY, GOOD PRACTICE / 245 wi
- Page 247 and 248:
Education for All Global Monitoring
- Page 249 and 250:
SETTING PRIORITIES FOR ACTION / 249
- Page 251 and 252:
Education for All Global Monitoring
- Page 253 and 254:
APPENDIX 1 / 253 include values, ca
- Page 255 and 256:
APPENDIX 1 / 255 Figure A1.4 illust
- Page 257 and 258:
APPENDIX 1 / 257 Table A1.1 (contin
- Page 259 and 260:
APPENDIX 1 / 259 Table A1.3: Change
- Page 261 and 262:
APPENDIX 2 / 261 Once the GER by ge
- Page 263 and 264:
INTRODUCTION / 263 Statistical anne
- Page 265 and 266:
INTRODUCTION / 265 To fill the gaps
- Page 267 and 268:
INTRODUCTION / 267 Metadata for nat
- Page 269 and 270:
INTRODUCTION / 269 (Continued) Year
- Page 271 and 272:
INTRODUCTION / 271 (Continued) Year
- Page 273 and 274:
STATISTICAL ANNEX / 273 Table 1 GNP
- Page 275 and 276:
STATISTICAL ANNEX / 275 Table 1 GNP
- Page 277 and 278:
STATISTICAL ANNEX / 277 Table 1 GNP
- Page 279 and 280:
STATISTICAL ANNEX / 279 Table 1 GNP
- Page 281 and 282:
STATISTICAL ANNEX / 281 Table 2A YO
- Page 283 and 284:
STATISTICAL ANNEX / 283 Table 2A YO
- Page 285 and 286:
STATISTICAL ANNEX / 285 Table 2A YO
- Page 287 and 288:
STATISTICAL ANNEX / 287 Table 2A YO
- Page 289 and 290:
STATISTICAL ANNEX / 289 Table 2B BO
- Page 291 and 292:
STATISTICAL ANNEX / 291 Table 2B BO
- Page 293 and 294:
STATISTICAL ANNEX / 293 Table 2B BO
- Page 295 and 296:
STATISTICAL ANNEX / 295 Table 2B BO
- Page 297 and 298:
STATISTICAL ANNEX / 297 Table 3 GRO
- Page 299 and 300:
STATISTICAL ANNEX / 299 Table 3 GRO
- Page 301 and 302:
STATISTICAL ANNEX / 301 Table 3 GRO
- Page 303 and 304:
STATISTICAL ANNEX / 303 Table 3 GRO
- Page 305 and 306:
STATISTICAL ANNEX / 305 Table 4 NET
- Page 307 and 308:
STATISTICAL ANNEX / 307 Table 4 NET
- Page 309 and 310:
STATISTICAL ANNEX / 309 Table 4 NET
- Page 311 and 312:
STATISTICAL ANNEX / 311 Table 4 NET
- Page 313 and 314:
STATISTICAL ANNEX / 313 Table 5 NET
- Page 315 and 316:
STATISTICAL ANNEX / 315 Table 5 NET
- Page 317 and 318:
STATISTICAL ANNEX / 317 Table 5 NET
- Page 319 and 320:
STATISTICAL ANNEX / 319 Table 5 NET
- Page 321 and 322:
STATISTICAL ANNEX / 321 Table 6 REP
- Page 323 and 324:
STATISTICAL ANNEX / 323 Table 6 REP
- Page 325 and 326:
STATISTICAL ANNEX / 325 Table 6 REP
- Page 327 and 328:
STATISTICAL ANNEX / 327 Table 6 REP
- Page 329 and 330:
STATISTICAL ANNEX / 329 Table 7 SUR
- Page 331 and 332:
STATISTICAL ANNEX / 331 Table 7 SUR
- Page 333 and 334:
STATISTICAL ANNEX / 333 Table 7 SUR
- Page 335 and 336:
STATISTICAL ANNEX / 335 Table 7 SUR
- Page 337 and 338:
STATISTICAL ANNEX / 337 Table 8 GRO
- Page 339 and 340:
STATISTICAL ANNEX / 339 Table 8 GRO
- Page 341 and 342:
STATISTICAL ANNEX / 341 Table 8 GRO
- Page 343 and 344:
STATISTICAL ANNEX / 343 Table 8 GRO
- Page 345 and 346:
STATISTICAL ANNEX / 345 Table 9A EN
- Page 347 and 348:
STATISTICAL ANNEX / 347 Table 9A EN
- Page 349 and 350:
STATISTICAL ANNEX / 349 Table 9A EN
- Page 351 and 352:
STATISTICAL ANNEX / 351 Table 9A EN
- Page 353 and 354:
STATISTICAL ANNEX / 353 Table 9B PE
- Page 355 and 356:
STATISTICAL ANNEX / 355 Table 9B PE
- Page 357 and 358:
STATISTICAL ANNEX / 357 Table 9B PE
- Page 359 and 360:
STATISTICAL ANNEX / 359 Table 9B PE
- Page 361 and 362:
STATISTICAL ANNEX / 361 Table 10A P
- Page 363 and 364:
STATISTICAL ANNEX / 363 Table 10A P
- Page 365 and 366:
STATISTICAL ANNEX / 365 Table 10A T
- Page 367 and 368:
STATISTICAL ANNEX / 367 Table 10A T
- Page 369 and 370:
STATISTICAL ANNEX / 369 Table 10B S
- Page 371 and 372:
STATISTICAL ANNEX / 371 Table 10B S
- Page 373 and 374:
STATISTICAL ANNEX / 373 Table 10B S
- Page 375 and 376:
STATISTICAL ANNEX / 375 Table 10B S
- Page 377 and 378:
STATISTICAL ANNEX / 377 Table 11 Pu
- Page 379 and 380:
STATISTICAL ANNEX / 379 Table 11 Pu
- Page 381 and 382:
STATISTICAL ANNEX / 381 Table 11 Pu
- Page 383 and 384:
STATISTICAL ANNEX / 383 Table 11 Pu
- Page 385 and 386:
STATISTICAL ANNEX / 385 Table 12 GO
- Page 387 and 388:
STATISTICAL ANNEX / 387 Table 12 GO
- Page 389 and 390:
STATISTICAL ANNEX / 389 Table 12 GO
- Page 391 and 392:
STATISTICAL ANNEX / 391 Table 12 GO
- Page 393 and 394:
STATISTICAL ANNEX / 393 Table 13 GO
- Page 395 and 396:
STATISTICAL ANNEX / 395 Table 13 GO
- Page 397 and 398:
STATISTICAL ANNEX / 397 Table 13 GO
- Page 399 and 400:
STATISTICAL ANNEX / 399 Table 13 GO
- Page 401 and 402:
STATISTICAL ANNEX / 401 Table 14 GO
- Page 403 and 404:
STATISTICAL ANNEX / 403 Table 14 GO
- Page 405 and 406:
STATISTICAL ANNEX / 405 Table 14 GO
- Page 407 and 408:
STATISTICAL ANNEX / 407 Table 14 GO
- Page 409 and 410:
ANNEX AID DATA / 409 youth and adul
- Page 411 and 412:
ANNEX AID DATA / 411 Aid to basic e
- Page 413 and 414:
ANNEX AID DATA / 413 Basic educatio
- Page 415 and 416:
ANNEX AID DATA / 415 Table 3 (conti
- Page 417 and 418:
ANNEX AID DATA / 417
- Page 419 and 420:
GLOSSARY / 419 Education for All De
- Page 421 and 422:
GLOSSARY / 421 Literacy educator. I
- Page 423 and 424:
GLOSSARY / 423 Repetition rate by g
- Page 425 and 426:
REFERENCES / 425 Banerjee, A. and K
- Page 427 and 428:
REFERENCES / 427 Burchfield, S. 199
- Page 429 and 430:
REFERENCES / 429 Desjardins, R. and
- Page 431 and 432:
REFERENCES / 431 Garcia Garrido, J.
- Page 433 and 434:
REFERENCES / 433 Hull, G. 2003. You
- Page 435 and 436:
REFERENCES / 435 Lind, A. 1988. Adu
- Page 437 and 438:
REFERENCES / 437 Nirantar. 1997. In
- Page 439 and 440:
REFERENCES / 439 Reh, M. (ed.). 198
- Page 441 and 442:
REFERENCES / 441 Street, B. (ed.).
- Page 443 and 444:
REFERENCES / 443 UNHCHR. 1993. Vien
- Page 445 and 446:
ABBREVIATIONS / 445 Abbreviations A
- Page 447 and 448:
ABBREVIATIONS / 447 NIR Net intake