LOCAL ECONOMIC DEVELOPMENT PLAN FOR TBILISI ... - LED
LOCAL ECONOMIC DEVELOPMENT PLAN FOR TBILISI ... - LED
LOCAL ECONOMIC DEVELOPMENT PLAN FOR TBILISI ... - LED

Create successful ePaper yourself
Turn your PDF publications into a flip-book with our unique Google optimized e-Paper software.
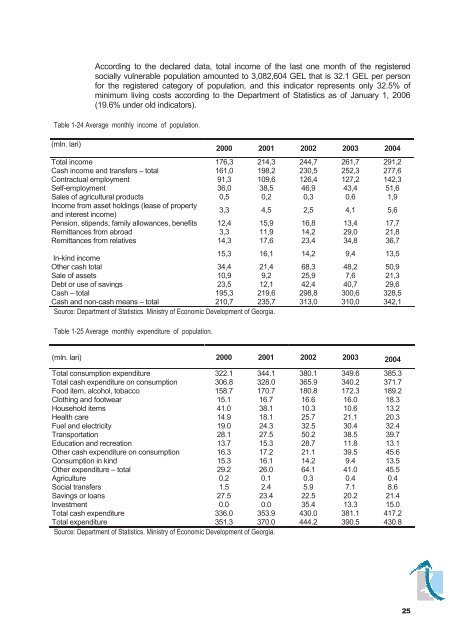
According to the declared data, total income of the last one month of the registered<br />
socially vulnerable population amounted to 3,082,604 GEL that is 32.1 GEL per person<br />
for the registered category of population, and this indicator represents only 32.5% of<br />
minimum living costs according to the Department of Statistics as of January 1, 2006<br />
(19.6% under old indicators).<br />
<br />
(mln. lari)<br />
2000 2001 2002 2003 2004<br />
Total income 176,3 214,3 244,7 261,7 291,2<br />
Cash income and transfers – total 161,0 198,2 230,5 252,3 277,6<br />
Contractual employment 91,3 109,6 126,4 127,2 142,3<br />
Self-employment 36,0 38,5 46,9 43,4 51,6<br />
Sales of agricultural products 0,5 0,2 0,3 0,6 1,9<br />
Income from asset holdings (lease of property<br />
and interest income)<br />
3,3 4,5 2,5 4,1 5,6<br />
Pension, stipends, family allowances, benefits 12,4 15,9 16,8 13,4 17,7<br />
Remittances from abroad 3,3 11,9 14,2 29,0 21,8<br />
Remittances from relatives 14,3 17,6 23,4 34,8 36,7<br />
In-kind income<br />
15,3 16,1 14,2 9,4 13,5<br />
Other cash total 34,4 21,4 68,3 48,2 50,9<br />
Sale of assets 10,9 9,2 25,9 7,6 21,3<br />
Debt or use of savings 23,5 12,1 42,4 40,7 29,6<br />
Cash – total 195,3 219,6 298,8 300,6 328,5<br />
Cash and non-cash means – total 210,7 235,7 313,0 310,0 342,1<br />
<br />
<br />
(mln. lari) 2000 2001 2002 2003 2004<br />
Total consumption expenditure 322.1 344.1 380.1 349.6 385.3<br />
Total cash expenditure on consumption 306.8 328.0 365.9 340.2 371.7<br />
Food item, alcohol, tobacco 158.7 170.7 180.8 172.3 189.2<br />
Clothing and footwear 15.1 16.7 16.6 16.0 18.3<br />
Household items 41.0 38.1 10.3 10.6 13.2<br />
Health care 14.9 18.1 25.7 21.1 20.3<br />
Fuel and electricity 19.0 24.3 32.5 30.4 32.4<br />
Transportation 28.1 27.5 50.2 38.5 39.7<br />
Education and recreation 13.7 15.3 28.7 11.8 13.1<br />
Other cash expenditure on consumption 16.3 17.2 21.1 39.5 45.6<br />
Consumption in kind 15.3 16.1 14.2 9.4 13.5<br />
Other expenditure – total 29.2 26.0 64.1 41.0 45.5<br />
Agriculture 0.2 0.1 0.3 0.4 0.4<br />
Social transfers 1.5 2.4 5.9 7.1 8.6<br />
Savings or loans 27.5 23.4 22.5 20.2 21.4<br />
Investment 0.0 0.0 35.4 13.3 15.0<br />
Total cash expenditure 336.0 353.9 430.0 381.1 417.2<br />
Total expenditure 351.3 370.0 444.2 390.5 430.8