- Page 2 and 3: TABLE OF CONTENTS Local Economy Ass
- Page 4 and 5: CHARTS TABLES
- Page 6 and 7: Report This report includes the
- Page 8 and 9: Tbilisi in region The capital of Ge
- Page 10 and 11: City of Tbilisi. By January 1, 2006
- Page 12 and 13: 1876 1897 1922 1926 1959 1979 1989
- Page 14 and 15: The demographic changes observed du
- Page 16 and 17: Analyzing the first indicator measu
- Page 18 and 19: The number of women increased sligh
- Page 20 and 21: Unemployment changes can be analyze
- Page 22 and 23: This indicator measures the average
- Page 24 and 25: The basic measure of the quality of
- Page 26 and 27: There have been two different perio
- Page 28 and 29: The demographic changes are primari
- Page 30 and 31: In thds of students Public universi
- Page 32 and 33: 2005 Tbilisi Saburtalo- Vake Isani-
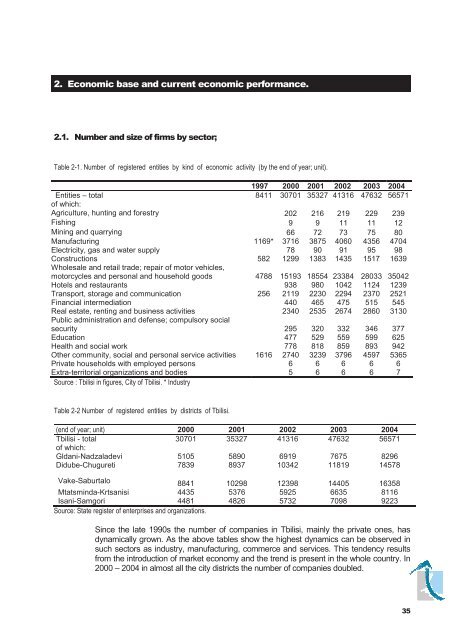
- Page 36 and 37: 2000 2001 2002 2003 2004 2005 Entit
- Page 38 and 39: Years Of which by: Total investment
- Page 40 and 41: Georgian exports are partially conc
- Page 42 and 43: Railroad Motovehicles Marine Air To
- Page 44 and 45: Key conclusions on the economic per
- Page 46 and 47: Population: 142,893,540 Age structu
- Page 48 and 49: Population: 46,710,816 (July 2006 e
- Page 50 and 51: state for pipelines and trade. The
- Page 52 and 53: Population: 5,213,898 (July 2006 es
- Page 54 and 55: Population: 7,320,815 (July 2006 es
- Page 56 and 57: 140 130 120 110 100 90 80 1995 1996
- Page 58 and 59: 190 180 170 160 150 140 130 120 110
- Page 60 and 61: Turnover in mnl GEL 8 000 7 000 6 0
- Page 62 and 63: Year Quarter Georgia - total City o
- Page 64 and 65: 100% Employment in enterprises sphe
- Page 66 and 67: Ascending rank Minimum Maximum Mean
- Page 68 and 69: in mln GEL 1998 1999 2000 2001 2002
- Page 70 and 71: In addition to being the leading gl
- Page 72 and 73: STRENGTHS • State and economy ref
- Page 74 and 75: Good outcomes reflecting the satisf
- Page 76 and 77: albumonous substances, modified dri
- Page 78 and 79: . (In thousand of tons, unless oth
- Page 80 and 81: of which: Year of which: of which:
- Page 82 and 83: LOCAL ECONOMIC DEVELOPMENT PLAN FOR
- Page 84 and 85:
CHARTS Chart 1-1 Population in Geor
- Page 86 and 87:
Report City of Tbilisi Competitiven
- Page 88 and 89:
1.2. Tbilisi in Georgian economy On
- Page 90 and 91:
Economic active population Table 1-
- Page 92 and 93:
Chart 1-3 Employment in Georgia and
- Page 94 and 95:
Turnover In business sector Table 1
- Page 96 and 97:
Chart 1-7 Earnings in business sect
- Page 98 and 99:
Chart 1-10 Comparative analysis of
- Page 100 and 101:
Different factors influence the cit
- Page 102 and 103:
The assessment results are presente
- Page 104 and 105:
City of Batumi Chart 2-3 City of Ba
- Page 106 and 107:
While assessing Tbilisi competitive
- Page 108 and 109:
Chart 2-5 City of Tbilisi in the re
- Page 110 and 111:
3. Identification of competitive ad
- Page 112 and 113:
On the basis of this assessment the
- Page 114 and 115:
application of new technologies. Th
- Page 116 and 117:
Transportation cluster. Table 3-5 T
- Page 118 and 119:
Creative cluster Table 3-7 Creative
- Page 120 and 121:
`
- Page 122 and 123:
CHARTS
- Page 124 and 125:
In order to strengthen the foundati
- Page 126 and 127:
the rest of the country. In each of
- Page 128 and 129:
Earnings in Tbilisi in business sec
- Page 130 and 131:
Construction turnover in Georgia in
- Page 132 and 133:
1 000 800 600 400 Comparative analy
- Page 134 and 135:
Trade turnover in Georgia in mln GE
- Page 136 and 137:
6000,0 5000,0 4000,0 3000,0 2000,0
- Page 138 and 139:
Industry turnover in Georgia in mln
- Page 140 and 141:
3000,0 2000,0 1000,0 Comparative an
- Page 142 and 143:
It is of key importance for the cit
- Page 144 and 145:
One of the elements of the process
- Page 146 and 147:
Companies opinion about their indus
- Page 148 and 149:
Last year almost half of the survey
- Page 150 and 151:
Most companies operating in the tou
- Page 152 and 153:
Next year 82% of the surveyed compa
- Page 154 and 155:
Score Sightseeing paths 27 Access t
- Page 156 and 157:
Such immanent feature of Tbilisi sp
- Page 158 and 159:
Law project on “privatization of
- Page 160 and 161:
example, construction of “Tsavkis
- Page 162 and 163:
number of micro bus taxis (“marsh
- Page 164 and 165:
As a result of social and economic
- Page 166 and 167:
Alternative Strategy implementation
- Page 168 and 169:
Marketing Tbilisi livable city and
- Page 170 and 171:
Survey how economy is developing, w
- Page 172 and 173:
When creating long-lasting mechanis
- Page 174 and 175:
.
- Page 176 and 177:
• • • -
- Page 178 and 179:
-
- Page 180 and 181:
Tourism development projects Touri
- Page 182 and 183:
Tourism development projects Touri
- Page 184 and 185:
− − • • • •
- Page 186 and 187:
- -
- Page 188 and 189:
- - - -
- Page 190 and 191:
LOCAL ECONOMIC DEVELOPMENT PLAN FOR
- Page 192 and 193:
CHARTS Chart 2-1 City strategy stru
- Page 194 and 195:
1. Strategic management framework a
- Page 196 and 197:
2. Integration of strategic managem
- Page 198 and 199:
On that common basis the city manag
- Page 200 and 201:
managerial, to take action based on
- Page 202 and 203:
3. Strategy implementation methodol
- Page 204 and 205:
3.2. Process of writing the Corpora
- Page 206 and 207:
3.3. Methodology of updating the Co
- Page 208 and 209:
Phase IV The announcement of the li
- Page 210 and 211:
4. Strategy implementation tools 21
- Page 212 and 213:
4.1. Corporate City Development Pla
- Page 214 and 215:
4.3. Programs card Program : Goal :
- Page 216 and 217:
4.4. Projects card Project Title: L
- Page 218 and 219:
III. Project identification 3.1. De
- Page 220 and 221:
5.3. Detailed budget tasks task des
- Page 222 and 223:
5. Appendix - Directive of the Mayo
- Page 224 and 225:
1. STRUCTURING TEAMS DEALING WITH T
- Page 226 and 227:
3. METHODOLOGY OF UPDATING THE LOCA
- Page 228 and 229:
COMPETENCE DISTRIBUTION IN THE PROC
- Page 230 and 231:
5. CRITERIA OF SELECTING PROJECTS F
- Page 232 and 233:
TABLE OF CONTENTS Introduction ....
- Page 234 and 235:
CHARTS Chart 1-1 Tbilisi in the reg
- Page 236 and 237:
1. Cities matter 1.1. Cities are ke
- Page 238 and 239:
Due to the overlapping effects of r
- Page 240 and 241:
Cities combine diversity - of popul
- Page 242 and 243:
While assessing the present conditi
- Page 244 and 245:
These and other important issues sh
- Page 246 and 247:
Financing business - such initiativ
- Page 248 and 249:
City of Kutaisi Chart 2-1 City of K
- Page 250 and 251:
3. New dimension of city policies (
- Page 252 and 253:
The clusters have been assessed in
- Page 254 and 255:
Creative cluster The support for th
- Page 256 and 257:
From the city’s economic policy p
- Page 258 and 259:
3.5.2. Spatial structure Such imman
- Page 260 and 261:
The results of the 25 April earthqu
- Page 262 and 263:
As for the mass and wholesale large
- Page 264 and 265:
4. Tbilisi economy Tbilisi is on th
- Page 266 and 267:
Employment in business sector in Tb
- Page 268 and 269:
4.4. Turnover in business sector Tu
- Page 270 and 271:
4.5. Earnings Earnings in business
- Page 272 and 273:
4.6. General data of external trade
- Page 274 and 275:
4.7. Key industries of Tbilisi econ
- Page 276 and 277:
Trade Chart 4-7 Turnover and employ
- Page 278 and 279:
A thorough analysis of the tourist,
- Page 280 and 281:
5. Vision TBILISI offers wide range
- Page 282 and 283:
6. Strategic directions • Booming
- Page 284 and 285:
• Time for business. Time for bus
- Page 286 and 287:
• A place to live. The main objec
- Page 288 and 289:
• The hospitable city. Culture an
- Page 290 and 291:
• People empower Tbilisi. This di
- Page 292 and 293:
7. Strategy implementation An impor
- Page 294 and 295:
Phase four - preparing the Plan doc
- Page 296 and 297:
LOCAL ECONOMIC DEVELOPMENT PLAN FOR
- Page 298 and 299:
TABLES Table 5-1 Tbilisi booming re
- Page 300 and 301:
On its way to becoming a regional c
- Page 302 and 303:
investments in such areas as teleco
- Page 304 and 305:
Tiflis in 1872. In 1883 this railwa
- Page 306 and 307:
Nowadays this second direction of t
- Page 308 and 309:
3. Vision for Tbilisi Economic futu
- Page 310 and 311:
5. Strategy implementation 5.1. Tbi
- Page 312 and 313:
PROGRAM You can serves the region f
- Page 314 and 315:
5.2. Time for business in Tbilisi a
- Page 316 and 317:
We build digital platform for our b
- Page 318 and 319:
If you want to buy land to build yo
- Page 320 and 321:
5.3. Tbilisi place to live action p
- Page 322 and 323:
PROGRAM Our neighborhoo d (ezo) Gre
- Page 324 and 325:
Table 5-4 Tbilisi hospitable city -
- Page 326 and 327:
5.5. People empower Tbilisi action
- Page 328 and 329:
PROGRAM Jobs for all How to upgrade
- Page 330:
6. Strategy implementation principl