LOCAL ECONOMIC DEVELOPMENT PLAN FOR TBILISI ... - LED
LOCAL ECONOMIC DEVELOPMENT PLAN FOR TBILISI ... - LED
LOCAL ECONOMIC DEVELOPMENT PLAN FOR TBILISI ... - LED
Create successful ePaper yourself
Turn your PDF publications into a flip-book with our unique Google optimized e-Paper software.
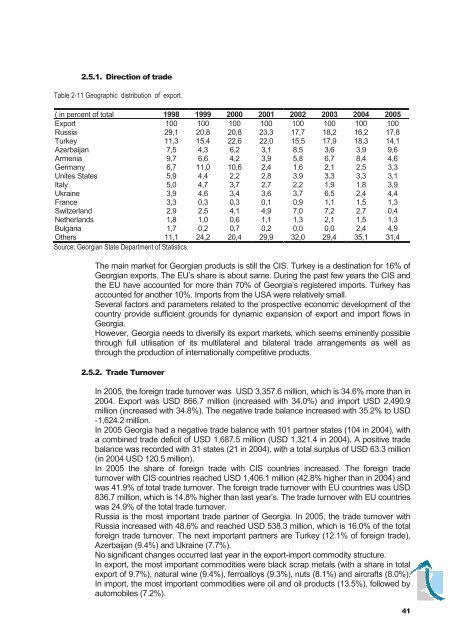
( in percent of total 1998 1999 2000 2001 2002 2003 2004 2005<br />
Export 100 100 100 100 100 100 100 100<br />
Russia 29,1 20,8 20,8 23,3 17,7 18,2 16,2 17,8<br />
Turkey 11,3 15,4 22,6 22,0 15,5 17,9 18,3 14,1<br />
Azerbaijan 7,5 4,3 6,2 3,1 8,5 3,6 3,9 9,6<br />
Armenia 9,7 6,6 4,2 3,9 5,8 6,7 8,4 4,6<br />
Germany 6,7 11,0 10,6 2,4 1,6 2,1 2,5 3,3<br />
Unites States 5,9 4,4 2,2 2,8 3,9 3,3 3,3 3,1<br />
Italy 5,0 4,7 3,7 2,7 2,2 1,9 1,8 3,9<br />
Ukraine 3,9 4,6 3,4 3,6 3,7 6,5 2,4 4,4<br />
France 3,3 0,3 0,3 0,1 0,9 1,1 1,5 1,3<br />
Switzerland 2,9 2,5 4,1 4,9 7,0 7,2 2,7 0,4<br />
Netherlands 1,8 1,0 0,6 1,1 1,3 2,1 1,5 1,3<br />
Bulgaria 1,7 0,2 0,7 0,2 0,0 0,0 2,4 4,9<br />
Others 11,1 24,2 20,4 29,9 32,0 29,4 35,1 31,4<br />
<br />
The main market for Georgian products is still the CIS. Turkey is a destination for 16% of<br />
Georgian exports. The EU’s share is about same. During the past few years the CIS and<br />
the EU have accounted for more than 70% of Georgia’s registered imports. Turkey has<br />
accounted for another 10%. Imports from the USA were relatively small.<br />
Several factors and parameters related to the prospective economic development of the<br />
country provide sufficient grounds for dynamic expansion of export and import flows in<br />
Georgia.<br />
However, Georgia needs to diversify its export markets, which seems eminently possible<br />
through full utilisation of its multilateral and bilateral trade arrangements as well as<br />
through the production of internationally competitive products.<br />
<br />
In 2005, the foreign trade turnover was USD 3,357.6 million, which is 34.6% more than in<br />
2004. Export was USD 866.7 million (increased with 34.0%) and import USD 2,490.9<br />
million (increased with 34.8%). The negative trade balance increased with 35.2% to USD<br />
-1,624.2 million.<br />
In 2005 Georgia had a negative trade balance with 101 partner states (104 in 2004), with<br />
a combined trade deficit of USD 1,687.5 million (USD 1,321.4 in 2004). A positive trade<br />
balance was recorded with 31 states (21 in 2004), with a total surplus of USD 63.3 million<br />
(in 2004 USD 120.5 million).<br />
In 2005 the share of foreign trade with CIS countries increased. The foreign trade<br />
turnover with CIS countries reached USD 1,406.1 million (42.8% higher than in 2004) and<br />
was 41.9% of total trade turnover. The foreign trade turnover with EU countries was USD<br />
836.7 million, which is 14.8% higher than last year’s. The trade turnover with EU countries<br />
was 24.9% of the total trade turnover.<br />
Russia is the most important trade partner of Georgia. In 2005, the trade turnover with<br />
Russia increased with 48.6% and reached USD 538.3 million, which is 16.0% of the total<br />
foreign trade turnover. The next important partners are Turkey (12.1% of foreign trade),<br />
Azerbaijan (9.4%) and Ukraine (7.7%).<br />
No significant changes occurred last year in the export-import commodity structure.<br />
In export, the most important commodities were black scrap metals (with a share in total<br />
export of 9.7%), natural wine (9.4%), ferroalloys (9.3%), nuts (8.1%) and aircrafts (8.0%).<br />
In import, the most important commodities were oil and oil products (13.5%), followed by<br />
automobiles (7.2%).


