NTRAC Final Study - Nebraska Department of Roads - State of ...
NTRAC Final Study - Nebraska Department of Roads - State of ...
NTRAC Final Study - Nebraska Department of Roads - State of ...

Create successful ePaper yourself
Turn your PDF publications into a flip-book with our unique Google optimized e-Paper software.
CHAPTER 6 – EXPRESS BUS PLANS<br />
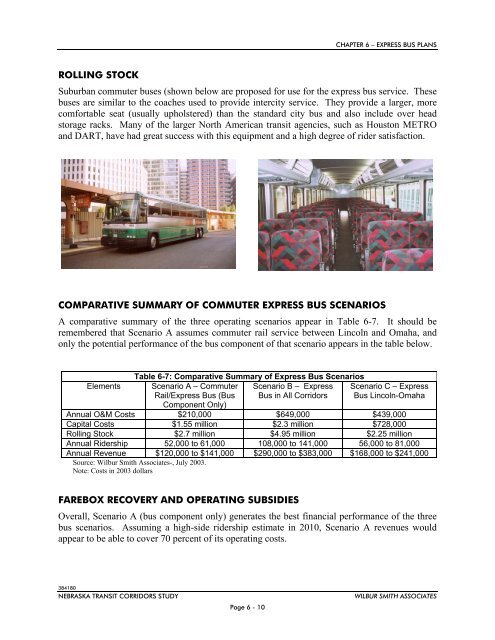
ROLLING STOCK<br />
Suburban commuter buses (shown below are proposed for use for the express bus service. These<br />
buses are similar to the coaches used to provide intercity service. They provide a larger, more<br />
comfortable seat (usually upholstered) than the standard city bus and also include over head<br />
storage racks. Many <strong>of</strong> the larger North American transit agencies, such as Houston METRO<br />
and DART, have had great success with this equipment and a high degree <strong>of</strong> rider satisfaction.<br />
COMPARATIVE SUMMARY OF COMMUTER EXPRESS BUS SCENARIOS<br />
A comparative summary <strong>of</strong> the three operating scenarios appear in Table 6-7. It should be<br />
remembered that Scenario A assumes commuter rail service between Lincoln and Omaha, and<br />
only the potential performance <strong>of</strong> the bus component <strong>of</strong> that scenario appears in the table below.<br />
Elements<br />
Table 6-7: Comparative Summary <strong>of</strong> Express Bus Scenarios<br />
Scenario A – Commuter Scenario B – Express<br />
Rail/Express Bus (Bus Bus in All Corridors<br />
Component Only)<br />
Scenario C – Express<br />
Bus Lincoln-Omaha<br />
Annual O&M Costs $210,000 $649,000 $439,000<br />
Capital Costs $1.55 million $2.3 million $728,000<br />
Rolling Stock $2.7 million $4.95 million $2.25 million<br />
Annual Ridership 52,000 to 61,000 108,000 to 141,000 56,000 to 81,000<br />
Annual Revenue $120,000 to $141,000 $290,000 to $383,000 $168,000 to $241,000<br />
Source: Wilbur Smith Associates-, July 2003.<br />
Note: Costs in 2003 dollars<br />
FAREBOX RECOVERY AND OPERATING SUBSIDIES<br />
Overall, Scenario A (bus component only) generates the best financial performance <strong>of</strong> the three<br />
bus scenarios. Assuming a high-side ridership estimate in 2010, Scenario A revenues would<br />
appear to be able to cover 70 percent <strong>of</strong> its operating costs.<br />
384180<br />
NEBRASKA TRANSIT CORRIDORS STUDY<br />
Page 6 - 10<br />
WILBUR SMITH ASSOCIATES