NTRAC Final Study - Nebraska Department of Roads - State of ...
NTRAC Final Study - Nebraska Department of Roads - State of ...
NTRAC Final Study - Nebraska Department of Roads - State of ...

Create successful ePaper yourself
Turn your PDF publications into a flip-book with our unique Google optimized e-Paper software.
CHAPTER 8 – FINANCIAL AND ECONOMIC EVALUATION<br />
As seen above, a weighted-average congestion cost <strong>of</strong> 2.37 cents per VMT is computed for<br />
automobile travel in the Fremont-Omaha corridor, and a congestion cost <strong>of</strong> 4.66 cents per VMT<br />
is computed for bus travel in that corridor.<br />
Congestion Costs Avoided<br />
An express bus option in the Fremont-Omaha corridor will generate the equivalent <strong>of</strong> 1,080,909<br />
vehicle-miles <strong>of</strong> travel (29,000 riders divided by a commuter car load factor <strong>of</strong> 1.1 car riders per<br />
car times 41 miles between Fremont and Omaha). These VMT times a car congestion cost<br />
$0.0237 equals a cost avoided (savings) <strong>of</strong> $25,618. These savings are reduced by new bus<br />
congestion costs, i.e. 62,484 bus miles <strong>of</strong> travel (6 buses times 41 miles times 254 service days a<br />
year) times $0.0466, or $2,912. Thus net savings would equal approximately $25,618 less<br />
$2,912, or $22,706. The net congestion costs for all corridors are calculated in the same way,<br />
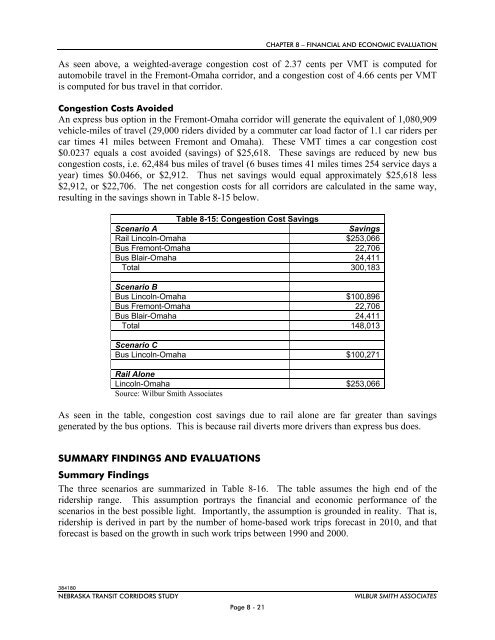
resulting in the savings shown in Table 8-15 below.<br />
Table 8-15: Congestion Cost Savings<br />
Scenario A<br />
Savings<br />
Rail Lincoln-Omaha $253,066<br />
Bus Fremont-Omaha 22,706<br />
Bus Blair-Omaha 24,411<br />
Total 300,183<br />
Scenario B<br />
Bus Lincoln-Omaha $100,896<br />
Bus Fremont-Omaha 22,706<br />
Bus Blair-Omaha 24,411<br />
Total 148,013<br />
Scenario C<br />
Bus Lincoln-Omaha $100,271<br />
Rail Alone<br />
Lincoln-Omaha $253,066<br />
Source: Wilbur Smith Associates<br />
As seen in the table, congestion cost savings due to rail alone are far greater than savings<br />
generated by the bus options. This is because rail diverts more drivers than express bus does.<br />
SUMMARY FINDINGS AND EVALUATIONS<br />
Summary Findings<br />
The three scenarios are summarized in Table 8-16. The table assumes the high end <strong>of</strong> the<br />
ridership range. This assumption portrays the financial and economic performance <strong>of</strong> the<br />
scenarios in the best possible light. Importantly, the assumption is grounded in reality. That is,<br />
ridership is derived in part by the number <strong>of</strong> home-based work trips forecast in 2010, and that<br />
forecast is based on the growth in such work trips between 1990 and 2000.<br />
384180<br />
NEBRASKA TRANSIT CORRIDORS STUDY<br />
Page 8 - 21<br />
WILBUR SMITH ASSOCIATES