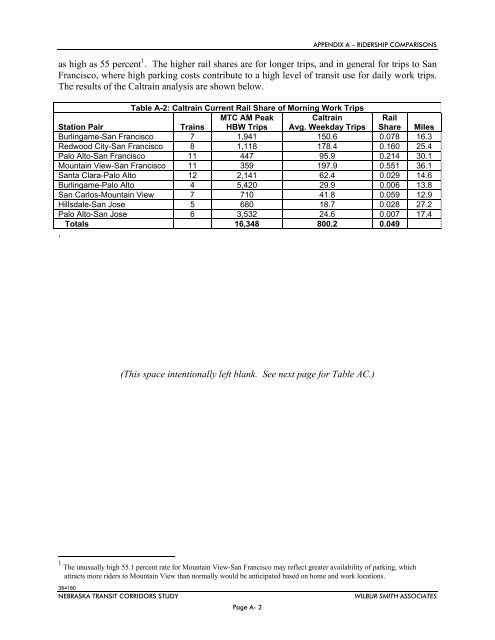
APPENDIX A – RIDERSHIP COMPARISONS as high as 55 percent 1 . The higher rail shares are for longer trips, and in general for trips to San Francisco, where high parking costs contribute to a high level <strong>of</strong> transit use for daily work trips. The results <strong>of</strong> the Caltrain analysis are shown below. Table A-2: Caltrain Current Rail Share <strong>of</strong> Morning Work Trips Station Pair Trains MTC AM Peak HBW Trips Caltrain Avg. Weekday Trips Rail Share Miles Burlingame-San Francisco 7 1,941 150.6 0.078 16.3 Redwood City-San Francisco 8 1,118 178.4 0.160 25.4 Palo Alto-San Francisco 11 447 95.9 0.214 30.1 Mountain View-San Francisco 11 359 197.9 0.551 36.1 Santa Clara-Palo Alto 12 2,141 62.4 0.029 14.6 Burlingame-Palo Alto 4 5,420 29.9 0.006 13.8 San Carlos-Mountain View 7 710 41.8 0.059 12.9 Hillsdale-San Jose 5 680 18.7 0.028 27.2 Palo Alto-San Jose 6 3,532 24.6 0.007 17.4 Totals 16,348 800.2 0.049 , (This space intentionally left blank. See next page for Table AC.) 1 The unusually high 55.1 percent rate for Mountain View-San Francisco may reflect greater availability <strong>of</strong> parking, which attracts more riders to Mountain View than normally would be anticipated based on home and work locations. 384180 NEBRASKA TRANSIT CORRIDORS STUDY Page A- 2 WILBUR SMITH ASSOCIATES
APPENDIX A – RIDERSHIP COMPARISONS Table A-3: Southeast High Speed Rail <strong>Study</strong> Estimate <strong>of</strong> Modal Demand Major Market Annual Person Trips Auto Air Rail Bus Total % Rail % Bus Washington, DC-VA-MD Richmond-Petersburg, VA 21,440,500 5,500 106,000 7,100 21,559,100 0.49% 0.03% Washington, DC-VA-MD Newport News-Norfolk-VaBch, VA 7,884,300 27,400 52,200 500 7,964,400 0.66% 0.01% Washington, DC-VA-MD Raleigh-Durham, NC 562,500 141,900 27,300 1,000 732,700 3.73% 0.14% Washington, DC-VA-MD Greensboro NC 409,200 56,100 8,400 600 474,300 1.77% 0.13% Washington, DC-VA-MD Charlotte, NC 152,300 105,100 7,900 700 266,000 2.97% 0.26% Washington, DC-VA-MD Greenville-Spartanburg, SC 52,200 37,700 5,600 300 95,800 5.85% 0.31% Washington, DC-VA-MD Atlanta, GA 119,700 512,200 17,400 700 650,000 2.68% 0.11% Washington, DC-VA-MD Columbia, SC 32,700 48,300 6,500 100 87,600 7.42% 0.11% Washington, DC-VA-MD Charleston, SC 61,700 103,300 7,100 - 172,100 4.13% - Washington, DC-VA-MD Savannah, GA 27,800 25,900 4,600 - 58,300 7.89% - Washington, DC-VA-MD Jacksonville, FL 14,900 81,000 1,300 - 97,200 1.34% - Richmond-Petersburg, VA Newport News-Norfolk-VaBch, VA 11,623,300 600 8,000 4,600 11,636,500 0.07% 0.04% Richmond-Petersburg, VA Raleigh-Durham, NC 488,000 8,200 2,500 400 499,100 0.50% 0.08% Richmond-Petersburg, VA Greensboro NC 251,500 12,400 1,100 400 265,400 0.41% 0.15% Richmond-Petersburg, VA Charlotte, NC 164,900 34,100 1,600 200 200,800 0.80% 0.10% Richmond-Petersburg, VA Greenville-Spartanburg, SC 40,400 12,100 - - 52,500 - - Richmond-Petersburg, VA Atlanta, GA 93,100 145,200 - 200 238,500 - 0.08% Richmond-Petersburg, VA Columbia, SC 33,600 7,800 1,100 - 42,500 2.59% - Richmond-Petersburg, VA Charleston, SC 26,800 13,300 2,400 - 42,500 5.65% - Richmond-Petersburg, VA Savannah, GA 15,400 - 200 - 15,600 1.28% - Richmond-Petersburg, VA Jacksonville, FL 19,600 22,700 1,100 - 43,400 2.53% - Raleigh-Durham, NC Greensboro NC 2,458,800 3,100 11,800 - 2,473,700 0.48% - Raleigh-Durham, NC Charlotte, NC 1,424,600 35,000 14,500 700 1,474,800 0.98% 0.05% Raleigh-Durham, NC Greenville-Spartanburg, SC 186,100 - - - 186,100 - - Raleigh-Durham, NC Atlanta, GA 158,300 205,500 - 100 363,900 - 0.03% Raleigh-Durham, NC Columbia, SC 39,800 2,900 800 - 43,500 1.84% - Raleigh-Durham, NC Savannah, GA 28,800 7,500 400 - 36,700 1.09% - Raleigh-Durham, NC Jacksonville, FL 5,600 21,800 600 - 28,000 2.14% - Greensboro NC Charlotte, NC 5,029,300 8,000 3,400 1,700 5,042,400 0.07% 0.03% Greensboro NC Greenville-Spartanburg, SC 304,400 9,200 300 - 313,900 0.10% - Greensboro NC Atlanta, GA 246,000 199,900 1,800 500 448,200 0.40% 0.11% Charlotte, NC Greenville-Spartanburg, SC 2,220,300 6,100 200 600 2,227,200 0.01% 0.03% Charlotte, NC Atlanta, GA 538,800 166,800 1,900 1,400 708,900 0.27% 0.20% Charlotte, NC Columbia, SC 3,353,100 7,500 - 1,000 3,361,600 - 0.03% Charlotte, NC Jacksonville, FL 45,900 40,600 - 200 86,700 - 0.23% Greenville-Spartanburg, SC Atlanta, GA 1,871,600 17,000 1,700 1,500 1,891,800 0.09% 0.08% Augusta, GA-SC Atlanta, GA 1,826,700 11,200 - - 1,837,900 - - Columbia, SC Atlanta, GA 561,400 38,700 - - 600,100 - - Columbia, SC Augusta, GA-SC 2,367,500 - - - 2,367,500 - - Columbia, SC Savannah, GA 80,000 - 200 - 80,200 0.25% - Columbia, SC Jacksonville, FL 69,300 3,000 500 100 72,900 0.69% 0.14% Charleston, SC Savannah, GA 152,700 400 2,000 - 155,100 1.29% - Charleston, SC Jacksonville, FL 94,500 15,400 1,000 - 110,900 0.90% - Savannah, GA Jacksonville, FL 396,500 100 700 500 397,800 0.18% 0.13% Total 66,974,400 2,200,500 304,100 25,100 69,504,100 AVE 1.81% 0.11% MEDIUM 0.98% 0.10% Source: "Southeast High Speed Rail Market & Demand <strong>Study</strong>," <strong>Final</strong> Report, August 1997. Authors: KPMG, et al. Exhibit 2-6, "Existing Person Trips by Mode Spring 1995 Surveys and other Data." 384180 NEBRASKA TRANSIT CORRIDORS STUDY Page A- 3 WILBUR SMITH ASSOCIATES