NTRAC Final Study - Nebraska Department of Roads - State of ...
NTRAC Final Study - Nebraska Department of Roads - State of ...
NTRAC Final Study - Nebraska Department of Roads - State of ...

You also want an ePaper? Increase the reach of your titles
YUMPU automatically turns print PDFs into web optimized ePapers that Google loves.
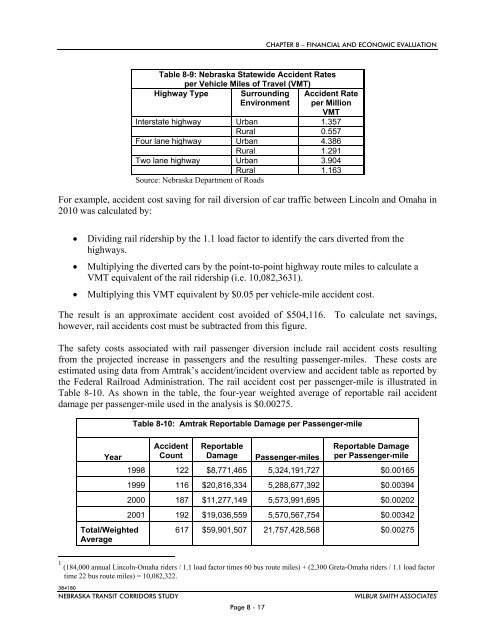
CHAPTER 8 – FINANCIAL AND ECONOMIC EVALUATION<br />
Table 8-9: <strong>Nebraska</strong> <strong>State</strong>wide Accident Rates<br />
per Vehicle Miles <strong>of</strong> Travel (VMT)<br />
Highway Type Surrounding<br />
Environment<br />
Accident Rate<br />
per Million<br />
VMT<br />
Interstate highway Urban 1.357<br />
Rural 0.557<br />
Four lane highway Urban 4.386<br />
Rural 1.291<br />
Two lane highway Urban 3.904<br />
Rural 1.163<br />
Source: <strong>Nebraska</strong> <strong>Department</strong> <strong>of</strong> <strong>Roads</strong><br />
For example, accident cost saving for rail diversion <strong>of</strong> car traffic between Lincoln and Omaha in<br />
2010 was calculated by:<br />
<br />
<br />
<br />
Dividing rail ridership by the 1.1 load factor to identify the cars diverted from the<br />
highways.<br />
Multiplying the diverted cars by the point-to-point highway route miles to calculate a<br />
VMT equivalent <strong>of</strong> the rail ridership (i.e. 10,082,3631).<br />
Multiplying this VMT equivalent by $0.05 per vehicle-mile accident cost.<br />
The result is an approximate accident cost avoided <strong>of</strong> $504,116. To calculate net savings,<br />
however, rail accidents cost must be subtracted from this figure.<br />
The safety costs associated with rail passenger diversion include rail accident costs resulting<br />
from the projected increase in passengers and the resulting passenger-miles. These costs are<br />
estimated using data from Amtrak’s accident/incident overview and accident table as reported by<br />
the Federal Railroad Administration. The rail accident cost per passenger-mile is illustrated in<br />
Table 8-10. As shown in the table, the four-year weighted average <strong>of</strong> reportable rail accident<br />
damage per passenger-mile used in the analysis is $0.00275.<br />
Year<br />
Total/Weighted<br />
Average<br />
Table 8-10: Amtrak Reportable Damage per Passenger-mile<br />
Accident Reportable<br />
Reportable Damage<br />
Count Damage Passenger-miles per Passenger-mile<br />
1998 122 $8,771,465 5,324,191,727 $0.00165<br />
1999 116 $20,816,334 5,288,677,392 $0.00394<br />
2000 187 $11,277,149 5,573,991,695 $0.00202<br />
2001 192 $19,036,559 5,570,567,754 $0.00342<br />
617 $59,901,507 21,757,428,568 $0.00275<br />
1 (184,000 annual Lincoln-Omaha riders / 1.1 load factor times 60 bus route miles) + (2,300 Greta-Omaha riders / 1.1 load factor<br />
time 22 bus route miles) = 10,082,322.<br />
384180<br />
NEBRASKA TRANSIT CORRIDORS STUDY<br />
Page 8 - 17<br />
WILBUR SMITH ASSOCIATES