NTRAC Final Study - Nebraska Department of Roads - State of ...
NTRAC Final Study - Nebraska Department of Roads - State of ...
NTRAC Final Study - Nebraska Department of Roads - State of ...

Create successful ePaper yourself
Turn your PDF publications into a flip-book with our unique Google optimized e-Paper software.
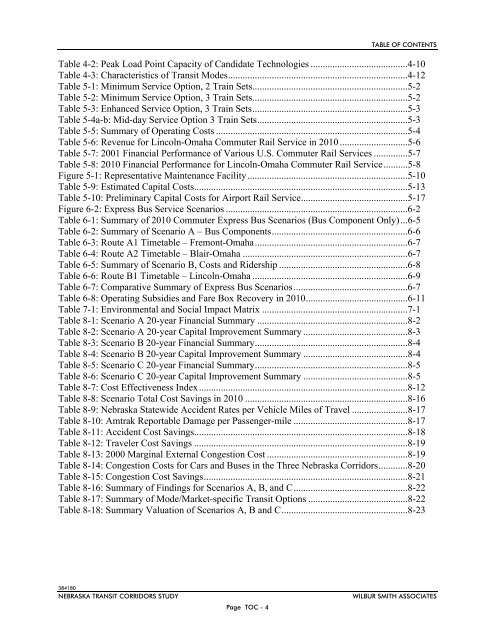
TABLE OF CONTENTS<br />
Table 4-2: Peak Load Point Capacity <strong>of</strong> Candidate Technologies ........................................4-10<br />
Table 4-3: Characteristics <strong>of</strong> Transit Modes..........................................................................4-12<br />
Table 5-1: Minimum Service Option, 2 Train Sets................................................................5-2<br />
Table 5-2: Minimum Service Option, 3 Train Sets................................................................5-2<br />
Table 5-3: Enhanced Service Option, 3 Train Sets................................................................5-3<br />
Table 5-4a-b: Mid-day Service Option 3 Train Sets..............................................................5-3<br />
Table 5-5: Summary <strong>of</strong> Operating Costs ...............................................................................5-4<br />
Table 5-6: Revenue for Lincoln-Omaha Commuter Rail Service in 2010 ............................5-6<br />
Table 5-7: 2001 Financial Performance <strong>of</strong> Various U.S. Commuter Rail Services ..............5-7<br />
Table 5-8: 2010 Financial Performance for Lincoln-Omaha Commuter Rail Service..........5-8<br />
Figure 5-1: Representative Maintenance Facility..................................................................5-10<br />
Table 5-9: Estimated Capital Costs........................................................................................5-13<br />
Table 5-10: Preliminary Capital Costs for Airport Rail Service............................................5-17<br />
Figure 6-2: Express Bus Service Scenarios ...........................................................................6-2<br />
Table 6-1: Summary <strong>of</strong> 2010 Commuter Express Bus Scenarios (Bus Component Only)...6-5<br />
Table 6-2: Summary <strong>of</strong> Scenario A – Bus Components........................................................6-6<br />
Table 6-3: Route A1 Timetable – Fremont-Omaha...............................................................6-7<br />
Table 6-4: Route A2 Timetable – Blair-Omaha ....................................................................6-7<br />
Table 6-5: Summary <strong>of</strong> Scenario B, Costs and Ridership .....................................................6-8<br />
Table 6-6: Route B1 Timetable – Lincoln-Omaha ................................................................6-9<br />
Table 6-7: Comparative Summary <strong>of</strong> Express Bus Scenarios...............................................6-7<br />
Table 6-8: Operating Subsidies and Fare Box Recovery in 2010..........................................6-11<br />
Table 7-1: Environmental and Social Impact Matrix ............................................................7-1<br />
Table 8-1: Scenario A 20-year Financial Summary ..............................................................8-2<br />
Table 8-2: Scenario A 20-year Capital Improvement Summary ...........................................8-3<br />
Table 8-3: Scenario B 20-year Financial Summary...............................................................8-4<br />
Table 8-4: Scenario B 20-year Capital Improvement Summary ...........................................8-4<br />
Table 8-5: Scenario C 20-year Financial Summary...............................................................8-5<br />
Table 8-6: Scenario C 20-year Capital Improvement Summary ...........................................8-5<br />
Table 8-7: Cost Effectiveness Index......................................................................................8-12<br />
Table 8-8: Scenario Total Cost Savings in 2010 ...................................................................8-16<br />
Table 8-9: <strong>Nebraska</strong> <strong>State</strong>wide Accident Rates per Vehicle Miles <strong>of</strong> Travel .......................8-17<br />
Table 8-10: Amtrak Reportable Damage per Passenger-mile ...............................................8-17<br />
Table 8-11: Accident Cost Savings........................................................................................8-18<br />
Table 8-12: Traveler Cost Savings ........................................................................................8-19<br />
Table 8-13: 2000 Marginal External Congestion Cost ..........................................................8-19<br />
Table 8-14: Congestion Costs for Cars and Buses in the Three <strong>Nebraska</strong> Corridors............8-20<br />
Table 8-15: Congestion Cost Savings....................................................................................8-21<br />
Table 8-16: Summary <strong>of</strong> Findings for Scenarios A, B, and C...............................................8-22<br />
Table 8-17: Summary <strong>of</strong> Mode/Market-specific Transit Options .........................................8-22<br />
Table 8-18: Summary Valuation <strong>of</strong> Scenarios A, B and C....................................................8-23<br />
384180<br />
NEBRASKA TRANSIT CORRIDORS STUDY<br />
Page TOC - 4<br />
WILBUR SMITH ASSOCIATES