NTRAC Final Study - Nebraska Department of Roads - State of ...
NTRAC Final Study - Nebraska Department of Roads - State of ...
NTRAC Final Study - Nebraska Department of Roads - State of ...

You also want an ePaper? Increase the reach of your titles
YUMPU automatically turns print PDFs into web optimized ePapers that Google loves.
CHAPTER 4 – TECHNOLOGY OPITONS<br />
Intercity rail: Amtrak<br />
What are not so numerous are examples <strong>of</strong> BRT. However, enough urban places have<br />
implemented some form <strong>of</strong> enhanced bus operations to establish a menu <strong>of</strong> available<br />
technologies ranging from traffic light priority hardware and s<strong>of</strong>tware, through various types <strong>of</strong><br />
surface street lane reservations (curb and median bus lanes, transit malls), up to exclusive<br />
busways. In Los Angeles, all three may be found:<br />
Expedited surface bus operations on Ventura and Wilshire Boulevards<br />
Highway lanes limited to buses and car pools on the San Bernardino Freeway<br />
Exclusive busway on the Harbor Freeway<br />
Service Performance<br />
The system built must accommodate initial forecast passenger loads and be expandable to handle<br />
future growth. These are both important capabilities. The forecast passenger volumes for the<br />
corridors under discussion are likely to be in the lower range <strong>of</strong> passenger capacity requirements.<br />
However, during some special events, such as for university <strong>of</strong> <strong>Nebraska</strong> football games, demand<br />
for travel between Omaha and Lincoln will be higher than normal and very peaked.<br />
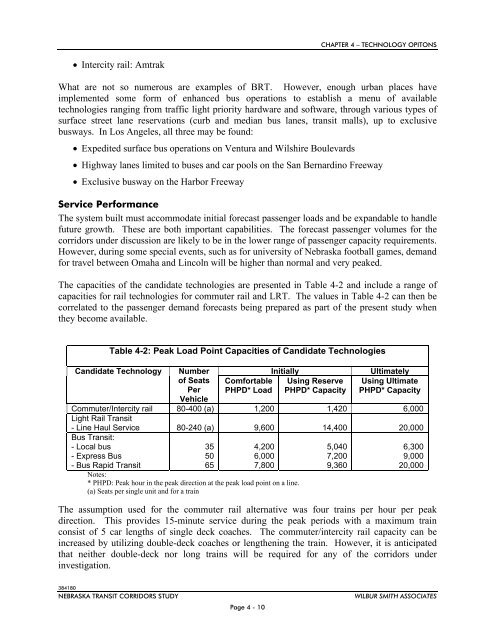
The capacities <strong>of</strong> the candidate technologies are presented in Table 4-2 and include a range <strong>of</strong><br />
capacities for rail technologies for commuter rail and LRT. The values in Table 4-2 can then be<br />
correlated to the passenger demand forecasts being prepared as part <strong>of</strong> the present study when<br />
they become available.<br />
Table 4-2: Peak Load Point Capacities <strong>of</strong> Candidate Technologies<br />
Candidate Technology<br />
Number<br />
<strong>of</strong> Seats<br />
Per<br />
Vehicle<br />
Comfortable<br />
PHPD* Load<br />
Initially<br />
Using Reserve<br />
PHPD* Capacity<br />
Ultimately<br />
Using Ultimate<br />
PHPD* Capacity<br />
Commuter/Intercity rail 80-400 (a) 1,200 1,420 6,000<br />
Light Rail Transit<br />
- Line Haul Service 80-240 (a) 9,600 14,400 20,000<br />
Bus Transit:<br />
- Local bus<br />
- Express Bus<br />
- Bus Rapid Transit<br />
35<br />
50<br />
65<br />
4,200<br />
6,000<br />
7,800<br />
Notes:<br />
* PHPD: Peak hour in the peak direction at the peak load point on a line.<br />
(a) Seats per single unit and for a train<br />
5,040<br />
7,200<br />
9,360<br />
6,300<br />
9,000<br />
20,000<br />
The assumption used for the commuter rail alternative was four trains per hour per peak<br />
direction. This provides 15-minute service during the peak periods with a maximum train<br />
consist <strong>of</strong> 5 car lengths <strong>of</strong> single deck coaches. The commuter/intercity rail capacity can be<br />
increased by utilizing double-deck coaches or lengthening the train. However, it is anticipated<br />
that neither double-deck nor long trains will be required for any <strong>of</strong> the corridors under<br />
investigation.<br />
384180<br />
NEBRASKA TRANSIT CORRIDORS STUDY<br />
Page 4 - 10<br />
WILBUR SMITH ASSOCIATES