NTRAC Final Study - Nebraska Department of Roads - State of ...
NTRAC Final Study - Nebraska Department of Roads - State of ...
NTRAC Final Study - Nebraska Department of Roads - State of ...

Create successful ePaper yourself
Turn your PDF publications into a flip-book with our unique Google optimized e-Paper software.
CHAPTER 8 – FINANCIAL AND ECONOMIC EVALUATION<br />
million in principal and interest payments would need to be added for annual subsidy for the first<br />
12 years (term <strong>of</strong> financing). Of this amount, $8.9 million would be due to financing rail related<br />
costs.<br />
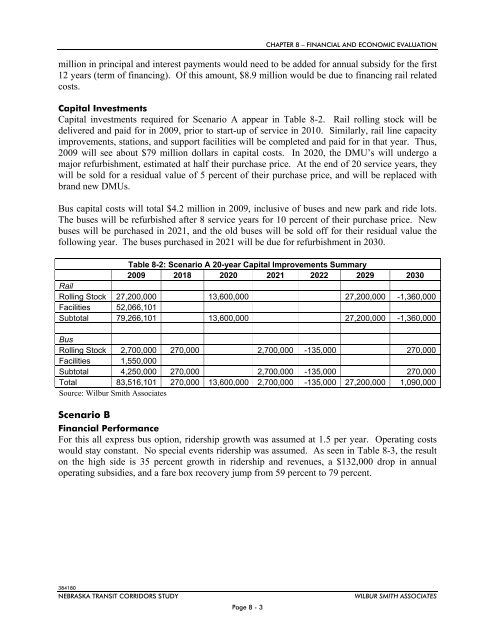
Capital Investments<br />
Capital investments required for Scenario A appear in Table 8-2. Rail rolling stock will be<br />
delivered and paid for in 2009, prior to start-up <strong>of</strong> service in 2010. Similarly, rail line capacity<br />
improvements, stations, and support facilities will be completed and paid for in that year. Thus,<br />
2009 will see about $79 million dollars in capital costs. In 2020, the DMU’s will undergo a<br />
major refurbishment, estimated at half their purchase price. At the end <strong>of</strong> 20 service years, they<br />
will be sold for a residual value <strong>of</strong> 5 percent <strong>of</strong> their purchase price, and will be replaced with<br />
brand new DMUs.<br />
Bus capital costs will total $4.2 million in 2009, inclusive <strong>of</strong> buses and new park and ride lots.<br />
The buses will be refurbished after 8 service years for 10 percent <strong>of</strong> their purchase price. New<br />
buses will be purchased in 2021, and the old buses will be sold <strong>of</strong>f for their residual value the<br />
following year. The buses purchased in 2021 will be due for refurbishment in 2030.<br />
Table 8-2: Scenario A 20-year Capital Improvements Summary<br />
2009 2018 2020 2021 2022 2029 2030<br />
Rail<br />
Rolling Stock 27,200,000 13,600,000 27,200,000 -1,360,000<br />
Facilities 52,066,101<br />
Subtotal 79,266,101 13,600,000 27,200,000 -1,360,000<br />
Bus<br />
Rolling Stock 2,700,000 270,000 2,700,000 -135,000 270,000<br />
Facilities 1,550,000<br />
Subtotal 4,250,000 270,000 2,700,000 -135,000 270,000<br />
Total 83,516,101 270,000 13,600,000 2,700,000 -135,000 27,200,000 1,090,000<br />
Source: Wilbur Smith Associates<br />
Scenario B<br />
Financial Performance<br />
For this all express bus option, ridership growth was assumed at 1.5 per year. Operating costs<br />
would stay constant. No special events ridership was assumed. As seen in Table 8-3, the result<br />
on the high side is 35 percent growth in ridership and revenues, a $132,000 drop in annual<br />
operating subsidies, and a fare box recovery jump from 59 percent to 79 percent.<br />
384180<br />
NEBRASKA TRANSIT CORRIDORS STUDY<br />
Page 8 - 3<br />
WILBUR SMITH ASSOCIATES