NTRAC Final Study - Nebraska Department of Roads - State of ...
NTRAC Final Study - Nebraska Department of Roads - State of ...
NTRAC Final Study - Nebraska Department of Roads - State of ...

Create successful ePaper yourself
Turn your PDF publications into a flip-book with our unique Google optimized e-Paper software.
CHAPTER 8 – FINANCIAL AND ECONOMIC EVALUATION<br />
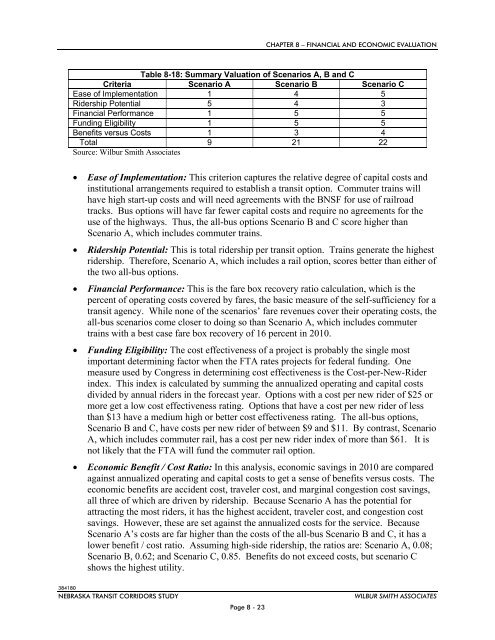
Table 8-18: Summary Valuation <strong>of</strong> Scenarios A, B and C<br />
Criteria Scenario A Scenario B Scenario C<br />
Ease <strong>of</strong> Implementation 1 4 5<br />
Ridership Potential 5 4 3<br />
Financial Performance 1 5 5<br />
Funding Eligibility 1 5 5<br />
Benefits versus Costs 1 3 4<br />
Total 9 21 22<br />
Source: Wilbur Smith Associates<br />
<br />
<br />
<br />
<br />
<br />
Ease <strong>of</strong> Implementation: This criterion captures the relative degree <strong>of</strong> capital costs and<br />
institutional arrangements required to establish a transit option. Commuter trains will<br />
have high start-up costs and will need agreements with the BNSF for use <strong>of</strong> railroad<br />
tracks. Bus options will have far fewer capital costs and require no agreements for the<br />
use <strong>of</strong> the highways. Thus, the all-bus options Scenario B and C score higher than<br />
Scenario A, which includes commuter trains.<br />
Ridership Potential: This is total ridership per transit option. Trains generate the highest<br />
ridership. Therefore, Scenario A, which includes a rail option, scores better than either <strong>of</strong><br />
the two all-bus options.<br />
Financial Performance: This is the fare box recovery ratio calculation, which is the<br />
percent <strong>of</strong> operating costs covered by fares, the basic measure <strong>of</strong> the self-sufficiency for a<br />
transit agency. While none <strong>of</strong> the scenarios’ fare revenues cover their operating costs, the<br />
all-bus scenarios come closer to doing so than Scenario A, which includes commuter<br />
trains with a best case fare box recovery <strong>of</strong> 16 percent in 2010.<br />
Funding Eligibility: The cost effectiveness <strong>of</strong> a project is probably the single most<br />
important determining factor when the FTA rates projects for federal funding. One<br />
measure used by Congress in determining cost effectiveness is the Cost-per-New-Rider<br />
index. This index is calculated by summing the annualized operating and capital costs<br />
divided by annual riders in the forecast year. Options with a cost per new rider <strong>of</strong> $25 or<br />
more get a low cost effectiveness rating. Options that have a cost per new rider <strong>of</strong> less<br />
than $13 have a medium high or better cost effectiveness rating. The all-bus options,<br />
Scenario B and C, have costs per new rider <strong>of</strong> between $9 and $11. By contrast, Scenario<br />
A, which includes commuter rail, has a cost per new rider index <strong>of</strong> more than $61. It is<br />
not likely that the FTA will fund the commuter rail option.<br />
Economic Benefit / Cost Ratio: In this analysis, economic savings in 2010 are compared<br />
against annualized operating and capital costs to get a sense <strong>of</strong> benefits versus costs. The<br />
economic benefits are accident cost, traveler cost, and marginal congestion cost savings,<br />
all three <strong>of</strong> which are driven by ridership. Because Scenario A has the potential for<br />
attracting the most riders, it has the highest accident, traveler cost, and congestion cost<br />
savings. However, these are set against the annualized costs for the service. Because<br />
Scenario A’s costs are far higher than the costs <strong>of</strong> the all-bus Scenario B and C, it has a<br />
lower benefit / cost ratio. Assuming high-side ridership, the ratios are: Scenario A, 0.08;<br />
Scenario B, 0.62; and Scenario C, 0.85. Benefits do not exceed costs, but scenario C<br />
shows the highest utility.<br />
384180<br />
NEBRASKA TRANSIT CORRIDORS STUDY<br />
Page 8 - 23<br />
WILBUR SMITH ASSOCIATES