NTRAC Final Study - Nebraska Department of Roads - State of ...
NTRAC Final Study - Nebraska Department of Roads - State of ...
NTRAC Final Study - Nebraska Department of Roads - State of ...

You also want an ePaper? Increase the reach of your titles
YUMPU automatically turns print PDFs into web optimized ePapers that Google loves.
CHAPTER 8 – FINANCIAL AND ECONOMIC EVALUATION<br />
Combination Trucks 10.87 3.70 0.98 49.34 16.78 4.44<br />
All Vehicles 4.40 1.50 0.40 19.72 6.71 1.78<br />
Source: Federal Highway Administration, 1997 Federal Highway Cost Allocation <strong>Study</strong>.<br />
The costs shown in Table 8-13 are additive to normal travel time and vehicle operating costs.<br />
Congestion costs are external to the trip maker in the sense that they represent the delay cost<br />
imposed on other motorists by the additional trip.<br />
The relevant congestion costs for this analysis are the ones shown for automobiles and buses.<br />
Congestion cost savings result from diverting drivers to buses, thus removing cars from the<br />
highways. However, these savings must be matched against whatever congestion that results<br />
from more buses on the highways now carrying the former drivers to produce a net savings.<br />
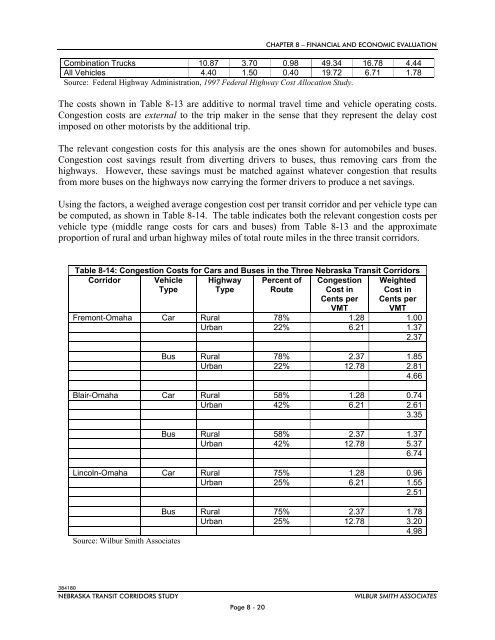
Using the factors, a weighed average congestion cost per transit corridor and per vehicle type can<br />
be computed, as shown in Table 8-14. The table indicates both the relevant congestion costs per<br />
vehicle type (middle range costs for cars and buses) from Table 8-13 and the approximate<br />
proportion <strong>of</strong> rural and urban highway miles <strong>of</strong> total route miles in the three transit corridors.<br />
Table 8-14: Congestion Costs for Cars and Buses in the Three <strong>Nebraska</strong> Transit Corridors<br />
Corridor Vehicle<br />
Type<br />
Highway<br />
Type<br />
Percent <strong>of</strong><br />
Route<br />
Congestion<br />
Cost in<br />
Cents per<br />
VMT<br />
Weighted<br />
Cost in<br />
Cents per<br />
VMT<br />
Fremont-Omaha Car Rural 78% 1.28 1.00<br />
Urban 22% 6.21 1.37<br />
2.37<br />
Bus Rural 78% 2.37 1.85<br />
Urban 22% 12.78 2.81<br />
4.66<br />
Blair-Omaha Car Rural 58% 1.28 0.74<br />
Urban 42% 6.21 2.61<br />
3.35<br />
Bus Rural 58% 2.37 1.37<br />
Urban 42% 12.78 5.37<br />
6.74<br />
Lincoln-Omaha Car Rural 75% 1.28 0.96<br />
Urban 25% 6.21 1.55<br />
2.51<br />
Bus Rural 75% 2.37 1.78<br />
Urban 25% 12.78 3.20<br />
4.98<br />
Source: Wilbur Smith Associates<br />
384180<br />
NEBRASKA TRANSIT CORRIDORS STUDY<br />
Page 8 - 20<br />
WILBUR SMITH ASSOCIATES