NTRAC Final Study - Nebraska Department of Roads - State of ...
NTRAC Final Study - Nebraska Department of Roads - State of ...
NTRAC Final Study - Nebraska Department of Roads - State of ...

Create successful ePaper yourself
Turn your PDF publications into a flip-book with our unique Google optimized e-Paper software.
CHAPTER 3 – RIDERSHIP POTENTIAL<br />
Methodology<br />
To understand the ridership potential for new transit services in the three <strong>Nebraska</strong> corridors, the<br />
analysis first tabulated existing daily trips between each city in its respective corridor. The<br />
analysis then applied intercity rail and bus intercity capture rates. These capture rates were<br />
derived from a review <strong>of</strong> similar service levels in similar rail and bus intercity markets.<br />
Sources<br />
The <strong>Nebraska</strong> <strong>Department</strong> <strong>of</strong> <strong>Roads</strong> calculated the daily intercity motor vehicle volumes<br />
for each city pair in its respective corridors for the year 2000.<br />
Total intercity travel in comparable corridors was taken from the American Travel Survey<br />
(ATS), conducted for the year 1995 by the Bureau <strong>of</strong> Transportation Statistics <strong>of</strong> the U.S.<br />
<strong>Department</strong> <strong>of</strong> Transportation.<br />
The intercity rail ridership in those corridors was provided by Amtrak, the operator.<br />
Representative rail and bus shares <strong>of</strong> intercity rail travel were identified from the<br />
“Southeast High Speed Rail Market and Demand <strong>Study</strong>”, North Carolina <strong>Department</strong> <strong>of</strong><br />
Transportation et al., 1997.<br />
County population projections were obtained from the Bureau <strong>of</strong> Business Research,<br />
University <strong>of</strong> <strong>Nebraska</strong> in Lincoln.<br />
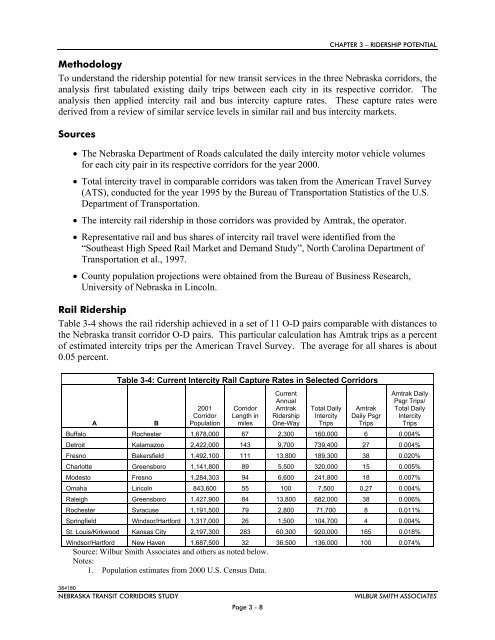
Rail Ridership<br />
Table 3-4 shows the rail ridership achieved in a set <strong>of</strong> 11 O-D pairs comparable with distances to<br />
the <strong>Nebraska</strong> transit corridor O-D pairs. This particular calculation has Amtrak trips as a percent<br />
<strong>of</strong> estimated intercity trips per the American Travel Survey. The average for all shares is about<br />
0.05 percent.<br />
Table 3-4: Current Intercity Rail Capture Rates in Selected Corridors<br />
Current<br />
Annual<br />
Amtrak<br />
Ridership<br />
One-Way<br />
Amtrak Daily<br />
Psgr Trips/<br />
Total Daily<br />
Intercity<br />
Trips<br />
A<br />
B<br />
2001<br />
Corridor<br />
Population<br />
Corridor<br />
Length in<br />
miles<br />
Total Daily<br />
Intercity<br />
Trips<br />
Amtrak<br />
Daily Psgr<br />
Trips<br />
Buffalo Rochester 1,678,000 67 2,300 160,000 6 0.004%<br />
Detroit Kalamazoo 2,422,000 143 9,700 739,400 27 0.004%<br />
Fresno Bakersfield 1,492,100 111 13,800 189,300 38 0.020%<br />
Charlotte Greensboro 1,141,800 89 5,500 320,000 15 0.005%<br />
Modesto Fresno 1,284,303 94 6,600 241,800 18 0.007%<br />
Omaha Lincoln 843,600 55 100 7,500 0.27 0.004%<br />
Raleigh Greensboro 1,427,900 84 13,800 682,000 38 0.006%<br />
Rochester Syracuse 1,191,500 79 2,800 71,700 8 0.011%<br />
Springfield Windsor/Hartford 1,317,000 26 1,500 104,700 4 0.004%<br />
St. Louis/Kirkwood Kansas City 2,197,300 283 60,300 920,000 165 0.018%<br />
Windsor/Hartford New Haven 1,687,500 32 36,500 136,000 100 0.074%<br />
Source: Wilbur Smith Associates and others as noted below.<br />
Notes:<br />
1. Population estimates from 2000 U.S. Census Data.<br />
384180<br />
NEBRASKA TRANSIT CORRIDORS STUDY<br />
Page 3 - 8<br />
WILBUR SMITH ASSOCIATES