NTRAC Final Study - Nebraska Department of Roads - State of ...
NTRAC Final Study - Nebraska Department of Roads - State of ...
NTRAC Final Study - Nebraska Department of Roads - State of ...
Create successful ePaper yourself
Turn your PDF publications into a flip-book with our unique Google optimized e-Paper software.
CHAPTER 8 – FINANCIAL AND ECONOMIC EVALUATION<br />
Overview <strong>of</strong> Analytical Framework and Data<br />
Framework for Comparison<br />
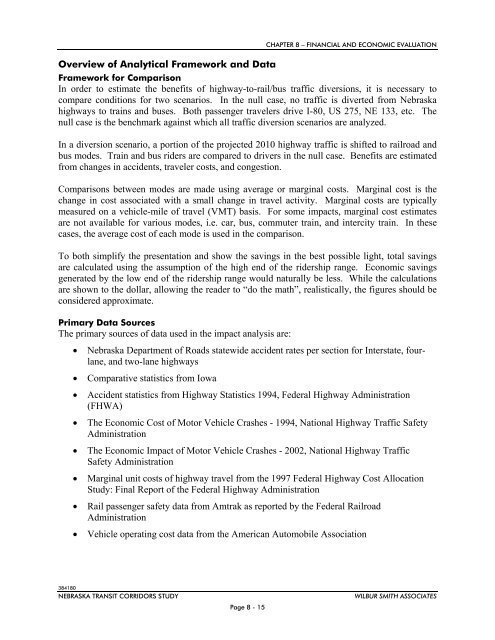
In order to estimate the benefits <strong>of</strong> highway-to-rail/bus traffic diversions, it is necessary to<br />
compare conditions for two scenarios. In the null case, no traffic is diverted from <strong>Nebraska</strong><br />
highways to trains and buses. Both passenger travelers drive I-80, US 275, NE 133, etc. The<br />
null case is the benchmark against which all traffic diversion scenarios are analyzed.<br />
In a diversion scenario, a portion <strong>of</strong> the projected 2010 highway traffic is shifted to railroad and<br />
bus modes. Train and bus riders are compared to drivers in the null case. Benefits are estimated<br />
from changes in accidents, traveler costs, and congestion.<br />
Comparisons between modes are made using average or marginal costs. Marginal cost is the<br />
change in cost associated with a small change in travel activity. Marginal costs are typically<br />
measured on a vehicle-mile <strong>of</strong> travel (VMT) basis. For some impacts, marginal cost estimates<br />
are not available for various modes, i.e. car, bus, commuter train, and intercity train. In these<br />
cases, the average cost <strong>of</strong> each mode is used in the comparison.<br />
To both simplify the presentation and show the savings in the best possible light, total savings<br />
are calculated using the assumption <strong>of</strong> the high end <strong>of</strong> the ridership range. Economic savings<br />
generated by the low end <strong>of</strong> the ridership range would naturally be less. While the calculations<br />
are shown to the dollar, allowing the reader to “do the math”, realistically, the figures should be<br />
considered approximate.<br />
Primary Data Sources<br />
The primary sources <strong>of</strong> data used in the impact analysis are:<br />
<br />
<br />
<br />
<br />
<br />
<br />
<br />
<br />
<strong>Nebraska</strong> <strong>Department</strong> <strong>of</strong> <strong>Roads</strong> statewide accident rates per section for Interstate, fourlane,<br />
and two-lane highways<br />
Comparative statistics from Iowa<br />
Accident statistics from Highway Statistics 1994, Federal Highway Administration<br />
(FHWA)<br />
The Economic Cost <strong>of</strong> Motor Vehicle Crashes - 1994, National Highway Traffic Safety<br />
Administration<br />
The Economic Impact <strong>of</strong> Motor Vehicle Crashes - 2002, National Highway Traffic<br />
Safety Administration<br />
Marginal unit costs <strong>of</strong> highway travel from the 1997 Federal Highway Cost Allocation<br />
<strong>Study</strong>: <strong>Final</strong> Report <strong>of</strong> the Federal Highway Administration<br />
Rail passenger safety data from Amtrak as reported by the Federal Railroad<br />
Administration<br />
Vehicle operating cost data from the American Automobile Association<br />
384180<br />
NEBRASKA TRANSIT CORRIDORS STUDY<br />
Page 8 - 15<br />
WILBUR SMITH ASSOCIATES


