NTRAC Final Study - Nebraska Department of Roads - State of ...
NTRAC Final Study - Nebraska Department of Roads - State of ...
NTRAC Final Study - Nebraska Department of Roads - State of ...

Create successful ePaper yourself
Turn your PDF publications into a flip-book with our unique Google optimized e-Paper software.
CHAPTER 8 – FINANCIAL AND ECONOMIC EVALUATION<br />
years. In both the low and high ridership cases, commuter ridership and revenue grow at 1.5<br />
percent per year (based on an average <strong>of</strong> the growth rates in population and employment in<br />
Lincoln, Douglas and Sarpy Counties). However, special event ridership is held to 2010 levels:<br />
the assumption is that they almost fill the trains as is, and thus do not grow as commuters do. A<br />
1.5 percent annual increase in commuters over 20 years results in almost a 35 percent total<br />
increase in the period. But the 1.5 percent annual increase in commuters coupled with the flat<br />
special event ridership results in total ridership and revenue increases <strong>of</strong> less the 35 percent over<br />
the 20-year period.<br />
Operating costs remain constant, as the growth is not sufficient to trigger any increases in service<br />
levels. The result is improvement financial performance, as seen in improved fare box recovery<br />
rates in the table below. With increasing revenues and constant costs, the operating subsidies<br />
required to cover operating costs over the period decrease, depending on the ridership<br />
assumption. The numbers in the table below are in 2003 dollars. Throughout this paper, the<br />
dollars figures are shown in constant dollars, excluding inflation.<br />
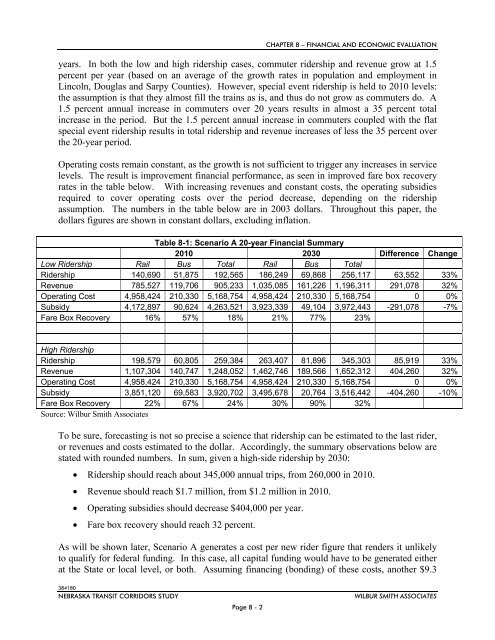
Table 8-1: Scenario A 20-year Financial Summary<br />
2010 2030 Difference Change<br />
Low Ridership Rail Bus Total Rail Bus Total<br />
Ridership 140,690 51,875 192,565 186,249 69,868 256,117 63,552 33%<br />
Revenue 785,527 119,706 905,233 1,035,085 161,226 1,196,311 291,078 32%<br />
Operating Cost 4,958,424 210,330 5,168,754 4,958,424 210,330 5,168,754 0 0%<br />
Subsidy 4,172,897 90,624 4,263,521 3,923,339 49,104 3,972,443 -291,078 -7%<br />
Fare Box Recovery 16% 57% 18% 21% 77% 23%<br />
High Ridership<br />
Ridership 198,579 60,805 259,384 263,407 81,896 345,303 85,919 33%<br />
Revenue 1,107,304 140,747 1,248,052 1,462,746 189,566 1,652,312 404,260 32%<br />
Operating Cost 4,958,424 210,330 5,168,754 4,958,424 210,330 5,168,754 0 0%<br />
Subsidy 3,851,120 69,583 3,920,702 3,495,678 20,764 3,516,442 -404,260 -10%<br />
Fare Box Recovery 22% 67% 24% 30% 90% 32%<br />
Source: Wilbur Smith Associates<br />
To be sure, forecasting is not so precise a science that ridership can be estimated to the last rider,<br />
or revenues and costs estimated to the dollar. Accordingly, the summary observations below are<br />
stated with rounded numbers. In sum, given a high-side ridership by 2030:<br />
Ridership should reach about 345,000 annual trips, from 260,000 in 2010.<br />
Revenue should reach $1.7 million, from $1.2 million in 2010.<br />
Operating subsidies should decrease $404,000 per year.<br />
Fare box recovery should reach 32 percent.<br />
As will be shown later, Scenario A generates a cost per new rider figure that renders it unlikely<br />
to qualify for federal funding. In this case, all capital funding would have to be generated either<br />
at the <strong>State</strong> or local level, or both. Assuming financing (bonding) <strong>of</strong> these costs, another $9.3<br />
384180<br />
NEBRASKA TRANSIT CORRIDORS STUDY<br />
Page 8 - 2<br />
WILBUR SMITH ASSOCIATES