NTRAC Final Study - Nebraska Department of Roads - State of ...
NTRAC Final Study - Nebraska Department of Roads - State of ...
NTRAC Final Study - Nebraska Department of Roads - State of ...

You also want an ePaper? Increase the reach of your titles
YUMPU automatically turns print PDFs into web optimized ePapers that Google loves.
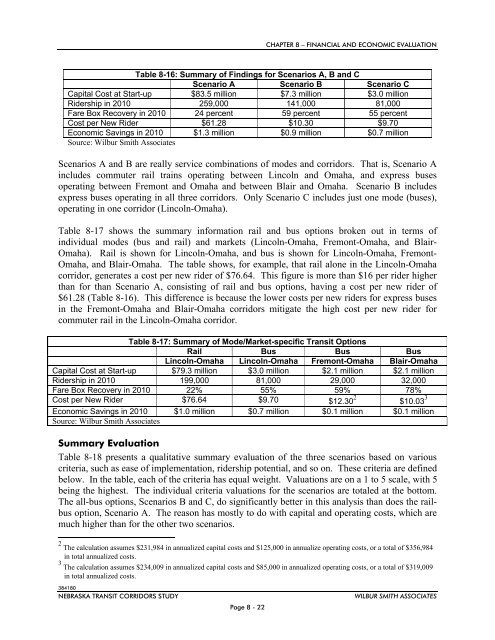
CHAPTER 8 – FINANCIAL AND ECONOMIC EVALUATION<br />
Table 8-16: Summary <strong>of</strong> Findings for Scenarios A, B and C<br />
Scenario A Scenario B Scenario C<br />
Capital Cost at Start-up $83.5 million $7.3 million $3.0 million<br />
Ridership in 2010 259,000 141,000 81,000<br />
Fare Box Recovery in 2010 24 percent 59 percent 55 percent<br />
Cost per New Rider $61.28 $10.30 $9.70<br />
Economic Savings in 2010 $1.3 million $0.9 million $0.7 million<br />
Source: Wilbur Smith Associates<br />
Scenarios A and B are really service combinations <strong>of</strong> modes and corridors. That is, Scenario A<br />
includes commuter rail trains operating between Lincoln and Omaha, and express buses<br />
operating between Fremont and Omaha and between Blair and Omaha. Scenario B includes<br />
express buses operating in all three corridors. Only Scenario C includes just one mode (buses),<br />
operating in one corridor (Lincoln-Omaha).<br />
Table 8-17 shows the summary information rail and bus options broken out in terms <strong>of</strong><br />
individual modes (bus and rail) and markets (Lincoln-Omaha, Fremont-Omaha, and Blair-<br />
Omaha). Rail is shown for Lincoln-Omaha, and bus is shown for Lincoln-Omaha, Fremont-<br />
Omaha, and Blair-Omaha. The table shows, for example, that rail alone in the Lincoln-Omaha<br />
corridor, generates a cost per new rider <strong>of</strong> $76.64. This figure is more than $16 per rider higher<br />
than for than Scenario A, consisting <strong>of</strong> rail and bus options, having a cost per new rider <strong>of</strong><br />
$61.28 (Table 8-16). This difference is because the lower costs per new riders for express buses<br />
in the Fremont-Omaha and Blair-Omaha corridors mitigate the high cost per new rider for<br />
commuter rail in the Lincoln-Omaha corridor.<br />
Table 8-17: Summary <strong>of</strong> Mode/Market-specific Transit Options<br />
Rail Bus Bus Bus<br />
Lincoln-Omaha Lincoln-Omaha Fremont-Omaha Blair-Omaha<br />
Capital Cost at Start-up $79.3 million $3.0 million $2.1 million $2.1 million<br />
Ridership in 2010 199,000 81,000 29,000 32,000<br />
Fare Box Recovery in 2010 22% 55% 59% 78%<br />
Cost per New Rider $76.64 $9.70 $12.30 2 $10.03 3<br />
Economic Savings in 2010 $1.0 million $0.7 million $0.1 million $0.1 million<br />
Source: Wilbur Smith Associates<br />
Summary Evaluation<br />
Table 8-18 presents a qualitative summary evaluation <strong>of</strong> the three scenarios based on various<br />
criteria, such as ease <strong>of</strong> implementation, ridership potential, and so on. These criteria are defined<br />
below. In the table, each <strong>of</strong> the criteria has equal weight. Valuations are on a 1 to 5 scale, with 5<br />
being the highest. The individual criteria valuations for the scenarios are totaled at the bottom.<br />
The all-bus options, Scenarios B and C, do significantly better in this analysis than does the railbus<br />
option, Scenario A. The reason has mostly to do with capital and operating costs, which are<br />
much higher than for the other two scenarios.<br />
2 The calculation assumes $231,984 in annualized capital costs and $125,000 in annualize operating costs, or a total <strong>of</strong> $356,984<br />
in total annualized costs.<br />
3 The calculation assumes $234,009 in annualized capital costs and $85,000 in annualized operating costs, or a total <strong>of</strong> $319,009<br />
in total annualized costs.<br />
384180<br />
NEBRASKA TRANSIT CORRIDORS STUDY<br />
Page 8 - 22<br />
WILBUR SMITH ASSOCIATES