NTRAC Final Study - Nebraska Department of Roads - State of ...
NTRAC Final Study - Nebraska Department of Roads - State of ...
NTRAC Final Study - Nebraska Department of Roads - State of ...

Create successful ePaper yourself
Turn your PDF publications into a flip-book with our unique Google optimized e-Paper software.
CHAPTER 5 – COMMUTER RAIL PLAN<br />
FARE BOX RECOVERY AND REQUIRED SUBSIDY<br />
The calculations <strong>of</strong> operating costs and revenue allow for the calculation <strong>of</strong> fare box recovery,<br />
which is the proportion <strong>of</strong> operating costs covered by fare revenue. The fare box recovery ratio<br />
is a common measure <strong>of</strong> transit operations to judge the relative “pr<strong>of</strong>itability” <strong>of</strong> services.<br />
(Transit services rarely are pr<strong>of</strong>itable per se; the question posed by this measure is really, how<br />
close to pr<strong>of</strong>itable are they? As the measure can be changed one way or another by changes in<br />
fares, fare box recovery is not a measure <strong>of</strong> efficiency.) These ratios vary widely. For example,<br />
in the initial years <strong>of</strong> The Coaster commute rail service in San Diego County, fare box recovery<br />
was about 20 percent <strong>of</strong> operating costs; this ratio increased to about 30 percent in 2001. In<br />
2001, Metra in Chicago generated a 46 percent fare box recovery, and New Jersey Transit<br />
enjoyed a fare box recovery ratio <strong>of</strong> 56 percent. On the other hand, Shore Line East in southern<br />
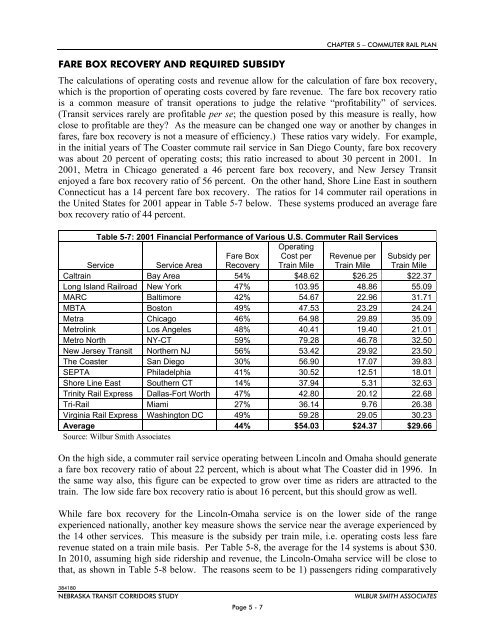
Connecticut has a 14 percent fare box recovery. The ratios for 14 commuter rail operations in<br />
the United <strong>State</strong>s for 2001 appear in Table 5-7 below. These systems produced an average fare<br />
box recovery ratio <strong>of</strong> 44 percent.<br />
Table 5-7: 2001 Financial Performance <strong>of</strong> Various U.S. Commuter Rail Services<br />
Operating<br />
Service<br />
Service Area<br />
Fare Box<br />
Recovery<br />
Cost per<br />
Train Mile<br />
Revenue per<br />
Train Mile<br />
Subsidy per<br />
Train Mile<br />
Caltrain Bay Area 54% $48.62 $26.25 $22.37<br />
Long Island Railroad New York 47% 103.95 48.86 55.09<br />
MARC Baltimore 42% 54.67 22.96 31.71<br />
MBTA Boston 49% 47.53 23.29 24.24<br />
Metra Chicago 46% 64.98 29.89 35.09<br />
Metrolink Los Angeles 48% 40.41 19.40 21.01<br />
Metro North NY-CT 59% 79.28 46.78 32.50<br />
New Jersey Transit Northern NJ 56% 53.42 29.92 23.50<br />
The Coaster San Diego 30% 56.90 17.07 39.83<br />
SEPTA Philadelphia 41% 30.52 12.51 18.01<br />
Shore Line East Southern CT 14% 37.94 5.31 32.63<br />
Trinity Rail Express Dallas-Fort Worth 47% 42.80 20.12 22.68<br />
Tri-Rail Miami 27% 36.14 9.76 26.38<br />
Virginia Rail Express Washington DC 49% 59.28 29.05 30.23<br />
Average 44% $54.03 $24.37 $29.66<br />
Source: Wilbur Smith Associates<br />
On the high side, a commuter rail service operating between Lincoln and Omaha should generate<br />
a fare box recovery ratio <strong>of</strong> about 22 percent, which is about what The Coaster did in 1996. In<br />
the same way also, this figure can be expected to grow over time as riders are attracted to the<br />
train. The low side fare box recovery ratio is about 16 percent, but this should grow as well.<br />
While fare box recovery for the Lincoln-Omaha service is on the lower side <strong>of</strong> the range<br />
experienced nationally, another key measure shows the service near the average experienced by<br />
the 14 other services. This measure is the subsidy per train mile, i.e. operating costs less fare<br />
revenue stated on a train mile basis. Per Table 5-8, the average for the 14 systems is about $30.<br />
In 2010, assuming high side ridership and revenue, the Lincoln-Omaha service will be close to<br />
that, as shown in Table 5-8 below. The reasons seem to be 1) passengers riding comparatively<br />
384180<br />
NEBRASKA TRANSIT CORRIDORS STUDY<br />
Page 5 - 7<br />
WILBUR SMITH ASSOCIATES