NTRAC Final Study - Nebraska Department of Roads - State of ...
NTRAC Final Study - Nebraska Department of Roads - State of ...
NTRAC Final Study - Nebraska Department of Roads - State of ...

Create successful ePaper yourself
Turn your PDF publications into a flip-book with our unique Google optimized e-Paper software.
Appendix A<br />
RIDERSHIP COMPARISONS<br />
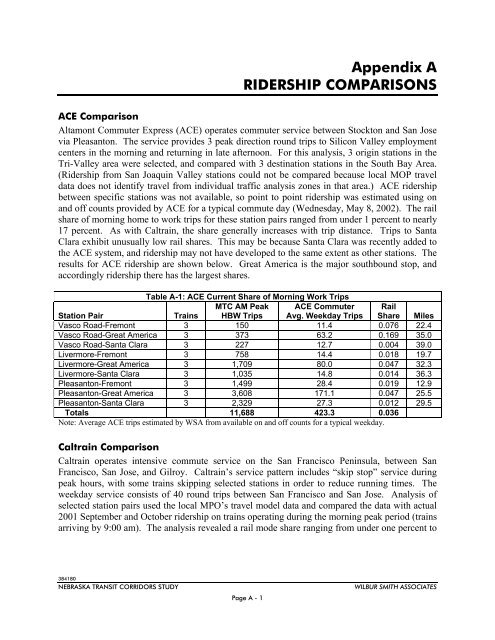
ACE Comparison<br />
Altamont Commuter Express (ACE) operates commuter service between Stockton and San Jose<br />
via Pleasanton. The service provides 3 peak direction round trips to Silicon Valley employment<br />
centers in the morning and returning in late afternoon. For this analysis, 3 origin stations in the<br />
Tri-Valley area were selected, and compared with 3 destination stations in the South Bay Area.<br />
(Ridership from San Joaquin Valley stations could not be compared because local MOP travel<br />
data does not identify travel from individual traffic analysis zones in that area.) ACE ridership<br />
between specific stations was not available, so point to point ridership was estimated using on<br />
and <strong>of</strong>f counts provided by ACE for a typical commute day (Wednesday, May 8, 2002). The rail<br />
share <strong>of</strong> morning home to work trips for these station pairs ranged from under 1 percent to nearly<br />
17 percent. As with Caltrain, the share generally increases with trip distance. Trips to Santa<br />
Clara exhibit unusually low rail shares. This may be because Santa Clara was recently added to<br />
the ACE system, and ridership may not have developed to the same extent as other stations. The<br />
results for ACE ridership are shown below. Great America is the major southbound stop, and<br />
accordingly ridership there has the largest shares.<br />
Table A-1: ACE Current Share <strong>of</strong> Morning Work Trips<br />
Station Pair<br />
Trains<br />
MTC AM Peak<br />
HBW Trips<br />
ACE Commuter<br />
Avg. Weekday Trips<br />
Rail<br />
Share Miles<br />
Vasco Road-Fremont 3 150 11.4 0.076 22.4<br />
Vasco Road-Great America 3 373 63.2 0.169 35.0<br />
Vasco Road-Santa Clara 3 227 12.7 0.004 39.0<br />
Livermore-Fremont 3 758 14.4 0.018 19.7<br />
Livermore-Great America 3 1,709 80.0 0.047 32.3<br />
Livermore-Santa Clara 3 1,035 14.8 0.014 36.3<br />
Pleasanton-Fremont 3 1,499 28.4 0.019 12.9<br />
Pleasanton-Great America 3 3,608 171.1 0.047 25.5<br />
Pleasanton-Santa Clara 3 2,329 27.3 0.012 29.5<br />
Totals 11,688 423.3 0.036<br />
Note: Average ACE trips estimated by WSA from available on and <strong>of</strong>f counts for a typical weekday.<br />
Caltrain Comparison<br />
Caltrain operates intensive commute service on the San Francisco Peninsula, between San<br />
Francisco, San Jose, and Gilroy. Caltrain’s service pattern includes “skip stop” service during<br />
peak hours, with some trains skipping selected stations in order to reduce running times. The<br />
weekday service consists <strong>of</strong> 40 round trips between San Francisco and San Jose. Analysis <strong>of</strong><br />
selected station pairs used the local MPO’s travel model data and compared the data with actual<br />
2001 September and October ridership on trains operating during the morning peak period (trains<br />
arriving by 9:00 am). The analysis revealed a rail mode share ranging from under one percent to<br />
384180<br />
NEBRASKA TRANSIT CORRIDORS STUDY<br />
Page A - 1<br />
WILBUR SMITH ASSOCIATES