

Low (web) Quality - BALTEX
Low (web) Quality - BALTEX
Low (web) Quality - BALTEX

You also want an ePaper? Increase the reach of your titles
YUMPU automatically turns print PDFs into web optimized ePapers that Google loves.
112<br />
Impact of surface waves in a Regional Climate Model<br />
Anna Rutgersson 1 , Björn Carlsson 1 , Alvaro Semedo 1 and Øyvind Sætra 2<br />
1) Department of Earth Sciences, Uppsala University, Sweden, Anna.rutgersson@met.uu.se<br />
2) Norwegian Meteorological Institute, Oslo, Norway<br />
1. Introduction<br />
When modelling the atmosphere it is of crucial importance<br />
to correctly describe the boundary conditions. The<br />
atmospheric-ocean boundary is an important source of<br />
turbulence and there is a significant exchange of momentum,<br />
heat and moisture. The marine atmospheric boundary layer<br />
(MABL) has a considerable impact on global climate<br />
atmospheric models since 70 % of the global surface is<br />
covered with water. The turbulence in the atmosphere as<br />
well as the surface fluxes is different over the ocean since<br />
the roughness of the surface (the waves) changes as a<br />
response to the atmospheric forcing. Surface waves can be<br />
divided into growing sea (young sea) and decaying sea<br />
(swell) with very different impact on the atmosphere.<br />
2. Model<br />
The atmosphere model RCA3 (Rossby Centre atmospheric<br />
regional climate model) is developed at SMHI (Swedish<br />
Meteorological and Hydrological institute) and its domain<br />
covers Europe. It is a hydrostatic model, with terrainfollowing<br />
coordinates and the calculations are semi-<br />
Lagrangian, semi-implicit and with 30-min time step. The<br />
horizontal resolution is c. 44 km and resolved in the vertical<br />
by 24 levels between 90 m above the surface and 10 hPa.<br />
The model is forced at the lateral boundaries by ERA40 data<br />
and from below by sea surface temperature (and ice) and<br />
phase speed of the dominant waves from the same data set.<br />
For more details, see e.g. Jones et al. (2004).<br />
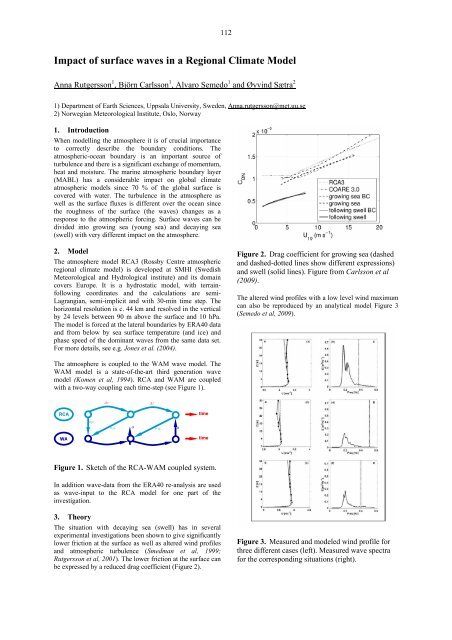
Figure 2. Drag coefficient for growing sea (dashed<br />
and dashed-dotted lines show different expressions)<br />
and swell (solid lines). Figure from Carlsson et al<br />
(2009).<br />
The altered wind profiles with a low level wind maximum<br />
can also be reproduced by an analytical model Figure 3<br />
(Semedo et al, 2009).<br />
The atmosphere is coupled to the WAM wave model. The<br />
WAM model is a state-of-the-art third generation wave<br />
model (Komen et al, 1994). RCA and WAM are coupled<br />
with a two-way coupling each time-step (see Figure 1).<br />
Δ t<br />
Δ t<br />
RCA<br />
time<br />
u 10<br />
u 10<br />
α<br />
u 10<br />
α<br />
WA<br />
time<br />
Figure 1. Sketch of the RCA-WAM coupled system.<br />
In addition wave-data from the ERA40 re-analysis are used<br />
as wave-input to the RCA model for one part of the<br />
investigation.<br />
3. Theory<br />
The situation with decaying sea (swell) has in several<br />
experimental investigations been shown to give significantly<br />
lower friction at the surface as well as altered wind profiles<br />
and atmospheric turbulence (Smedman et al, 1999;<br />
Rutgersson et al, 2001). The lower friction at the surface can<br />
be expressed by a reduced drag coefficient (Figure 2).<br />
Figure 3. Measured and modeled wind profile for<br />
three different cases (left). Measured wave spectra<br />
for the corresponding situations (right).


