

Low (web) Quality - BALTEX
Low (web) Quality - BALTEX
Low (web) Quality - BALTEX

Create successful ePaper yourself
Turn your PDF publications into a flip-book with our unique Google optimized e-Paper software.
155<br />
High-resolution simulation of a windstorm event to assess sampling<br />
characteristics of windstorm measures based on observations<br />
Lars Bärring 1 , Włodzimierz Pawlak 2 , Krzysztof Fortuniak 2 and Ulf Andrae 1<br />
1 Swedish Meteorological and Hydrological Institute, Norrköping, Sweden, lars.barring@smhi.se;<br />
2 University of Łódź, Department of Meteorology and Climatology, Łodź, Poland<br />
1. Background<br />
Extra-tropical cyclone frequency and intensity are currently<br />
under intense scrutiny because of the destruction recent<br />
windstorms have brought to Europe, and because they are a<br />
major meridional heat transport mechanism that may<br />
respond to differential latitudinal warming trends. There are<br />
two fundamental questions that arise in this context; how has<br />
the wind climate varied back in time; and what future variations<br />
and possible changes do the climate change scenarios<br />
suggest? The former question is analysed using observational<br />
data, mainly indirect measures based on sea-level pressure<br />
that is less influenced by inhomogeneity problems<br />
compared to direct wind observations (Carretero et al.,<br />
1998). The latter question is addressed using climate models<br />
scenarios (e.g Ulbrich et al., 2008, Weisse et al., 2009).<br />
The two different data types have sampling characteristics:<br />
observational point data from (usually rather sparse) station<br />
networks and observation frequency of typically 2-4 times<br />
per day, and gridded climate model data, typically having<br />
20-50 km spatial resolution (regional models) or 100-250<br />
km (global models) and temporal frequency of 0.5-6 h. To<br />
gain insight in how these two sources of information on<br />
historic and future wind climate can be related to each other<br />
the effect of these differences need to be assessed.<br />
Here we use the high-resolution NWP model AROME<br />
(http://www.cnrm.meteo.fr/gmap/accueil.html) to analyse<br />
the sampling properties of several common measures of<br />
observed wind conditions. The measures include high<br />
percentiles of geostrophic wind (Schmidt and von Storch,<br />
1993; Alexandersson et al. 1998, 2000; Trenberth et al.<br />
2007; Matulla et al. 2007), and Eulerian storminess indices<br />
(Alexandersson et al. 1998; Carretero et al., 1998; Bärring<br />
and von Storch, 2004; Bärring and Fortuniak, 2009).<br />
2. Data and Methods<br />
The AROME (“Applications of Research to Operations at<br />
MEsoscale”) non-hydrostatic NWP model is currently under<br />
development by an international consortium lead by CNRM<br />
and MétéoFrance and involving collaboration with SMHI<br />
(Andrae, 2006) and others. For this experiment AROME is<br />
used to downscale the Gudrun windstorm event that caused<br />
severe damage in southern Sweden. The domain covers<br />
southern Sweden (Fig. 1) and surroundings with a<br />
resolution of 2.5 km. The simulated period runs from<br />
2005-01-08 00UTC to 2005-01-09 00UTC. Initial<br />
conditions and lateral boundary conditions are taken from<br />
the operational Hirlam 11 km analysis. The time-step is 30<br />
s and data is stored for every 10 minutes.<br />
The simulated surface pressure was evaluated using<br />
available SYNOP and automatic stations (Figure 2) before<br />
transforming to mean sea-level pressure (MSLP). The<br />
simulated pressure is close to the observed pressure<br />
despite no data assimilation was used (Figure 2). The<br />
minor discrepancies are not important because the focus is<br />
not on an exact representation of this specific windstorm<br />
event, but rather to get a spatially complete coverage of a<br />
realistic windstorm event to sample from.<br />
Figure 2. Temporal evolution of the average surface<br />
pressure at 61 stations (red) and the corresponding<br />
simulated values (green).<br />
Geostrophic winds were then calculated from 10 000 randomly<br />
placed triplets of gridcells (Figure 3). The gridcells<br />
were selected so that the triangles were approximately<br />
equilateral within 20% at 500 km, as well as at 250 km<br />
thus mimicking different station network densities.<br />
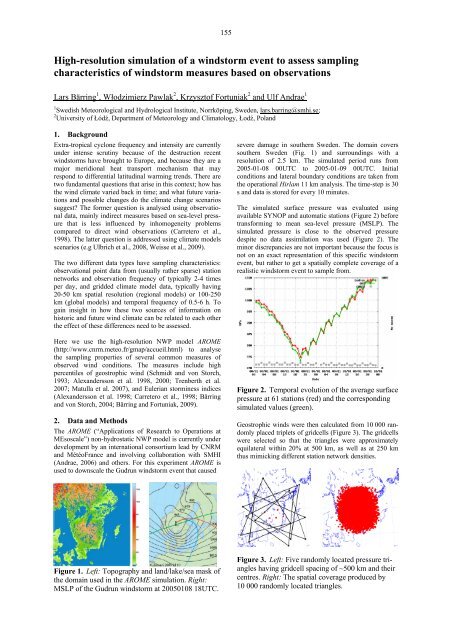
Figure 1. Left: Topography and land/lake/sea mask of<br />
the domain used in the AROME simulation. Right:<br />
MSLP of the Gudrun windstorm at 20050108 18UTC.<br />
Figure 3. Left: Five randomly located pressure triangles<br />
having gridcell spacing of ~500 km and their<br />
centres. Right: The spatial coverage produced by<br />
10 000 randomly located triangles.


