

Low (web) Quality - BALTEX
Low (web) Quality - BALTEX
Low (web) Quality - BALTEX

Create successful ePaper yourself
Turn your PDF publications into a flip-book with our unique Google optimized e-Paper software.
17<br />
where k represents the number of the category. S varies<br />
between 0 indicating that no overlap exists among the<br />
distributions, and 1, when both distributions are identical.<br />
The S score as calculated from the different data is presented<br />
in Figure 3. In winter season, the CGCM and the CRCM<br />
display similar skill to simulate the frequency and intensity<br />
of observed daily values by showing similar values of the S<br />
score, independently of the region considered (with maybe<br />
the exception of BC and ALTA regions).<br />
In summer, models have more difficulties to reproduce the<br />
observed daily distributions, presenting smaller values of S<br />
than in wintertime. The CGCM shows a better agreement<br />
with observed data than the CRCM and this improvement is<br />
mainly coming from a better simulation of the frequency of<br />
observed dry days (not shown).<br />
DJF<br />
JJA<br />
Figure 3. S score calculated between the simulated and<br />
observed distribution.<br />
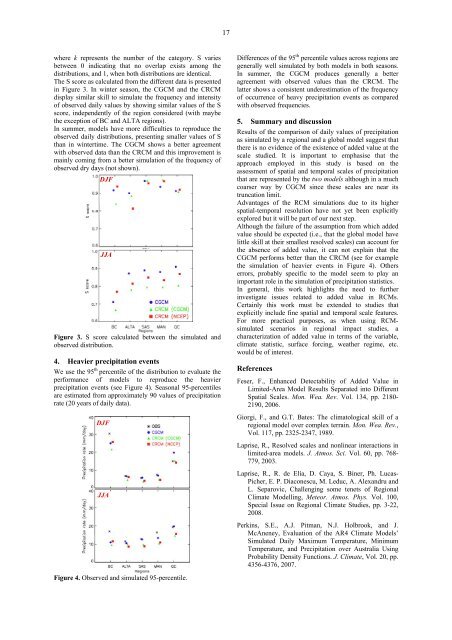
4. Heavier precipitation events<br />
We use the 95 th percentile of the distribution to evaluate the<br />
performance of models to reproduce the heavier<br />
precipitation events (see Figure 4). Seasonal 95-percentiles<br />
are estimated from approximately 90 values of precipitation<br />
rate (20 years of daily data).<br />
DJF<br />
Differences of the 95 th percentile values across regions are<br />
generally well simulated by both models in both seasons.<br />
In summer, the CGCM produces generally a better<br />
agreement with observed values than the CRCM. The<br />
latter shows a consistent underestimation of the frequency<br />
of occurrence of heavy precipitation events as compared<br />
with observed frequencies.<br />
5. Summary and discussion<br />
Results of the comparison of daily values of precipitation<br />
as simulated by a regional and a global model suggest that<br />
there is no evidence of the existence of added value at the<br />
scale studied. It is important to emphasise that the<br />
approach employed in this study is based on the<br />
assessment of spatial and temporal scales of precipitation<br />
that are represented by the two models although in a much<br />
coarser way by CGCM since these scales are near its<br />
truncation limit.<br />
Advantages of the RCM simulations due to its higher<br />
spatial-temporal resolution have not yet been explicitly<br />
explored but it will be part of our next step.<br />
Although the failure of the assumption from which added<br />
value should be expected (i.e., that the global model have<br />
little skill at their smallest resolved scales) can account for<br />
the absence of added value, it can not explain that the<br />
CGCM performs better than the CRCM (see for example<br />
the simulation of heavier events in Figure 4). Others<br />
errors, probably specific to the model seem to play an<br />
important role in the simulation of precipitation statistics.<br />
In general, this work highlights the need to further<br />
investigate issues related to added value in RCMs.<br />
Certainly this work must be extended to studies that<br />
explicitly include fine spatial and temporal scale features.<br />
For more practical purposes, as when using RCMsimulated<br />
scenarios in regional impact studies, a<br />
characterization of added value in terms of the variable,<br />
climate statistic, surface forcing, weather regime, etc.<br />
would be of interest.<br />
References<br />
Feser, F., Enhanced Detectability of Added Value in<br />
Limited-Area Model Results Separated into Different<br />
Spatial Scales. Mon. Wea. Rev. Vol. 134, pp. 2180-<br />
2190, 2006.<br />
Giorgi, F., and G.T. Bates: The climatological skill of a<br />
regional model over complex terrain. Mon. Wea. Rev.,<br />
Vol. 117, pp. 2325-2347, 1989.<br />
Laprise, R., Resolved scales and nonlinear interactions in<br />
limited-area models. J. Atmos. Sci. Vol. 60, pp. 768-<br />
779, 2003.<br />
JJA<br />
Laprise, R., R. de Elía, D. Caya, S. Biner, Ph. Lucas-<br />
Picher, E. P. Diaconescu, M. Leduc, A. Alexandru and<br />
L. Separovic, Challenging some tenets of Regional<br />
Climate Modelling, Meteor. Atmos. Phys. Vol. 100,<br />
Special Issue on Regional Climate Studies, pp. 3-22,<br />
2008.<br />
Perkins, S.E., A.J. Pitman, N.J. Holbrook, and J.<br />
McAneney, Evaluation of the AR4 Climate Models’<br />
Simulated Daily Maximum Temperature, Minimum<br />
Temperature, and Precipitation over Australia Using<br />
Probability Density Functions. J. Climate, Vol. 20, pp.<br />
4356-4376, 2007.<br />
Figure 4. Observed and simulated 95-percentile.


